
When analyzing Ether’s (ETH) price chart, one could conclude that the 3-month long bearish trend has been broken for a few reasons. The current $3,100 price range represents a 43% recovery in 15 days and, more importantly, the descending channel resistance was ruptured on Feb. 7.
Should Ether bulls start celebrating and calling for $4,000 and higher? That largely depends on how retail traders are positioned, along with the Ethereum network’s on-chain metrics. For instance, is the $30-plus transaction fee impacting the use of decentralized applications (dApps), or are there any other factors that will prohibit Ether’s price growth?

On a brighter note, on Feb. 7, Big Four auditor KPMG’s Canadian wing announced the addition of Bitcoin and Ether to its corporate treasury. The decision reflects KPMG Canada’s belief that cryptocurrencies are a “maturing asset class,” according to Benjie Thomas, a managing partner for the firm.
Derivatives data tells a different story
To understand how confident traders are about Ether’s price recovery, one should analyze the perpetual contracts futures data. This instrument is the retail traders’ preferred market because its price tends to track the regular spot markets.
In any futures contract trade, longs (buyers) and shorts (sellers) are matched at all times, but their use of leverage varies. Consequently, exchanges will charge a funding rate to whichever side demands more leverage, and this fee is paid to the opposing side.

One should analyze the Ethereum network’s on-chain data to understand if the lack of confidence is specific to leverage trading. For example, even though there is no set relation between Ether’s price and network use, low transaction volume and a decline in active users could be a concern if decoupled from a price hike.
On-chain metrics raise concern
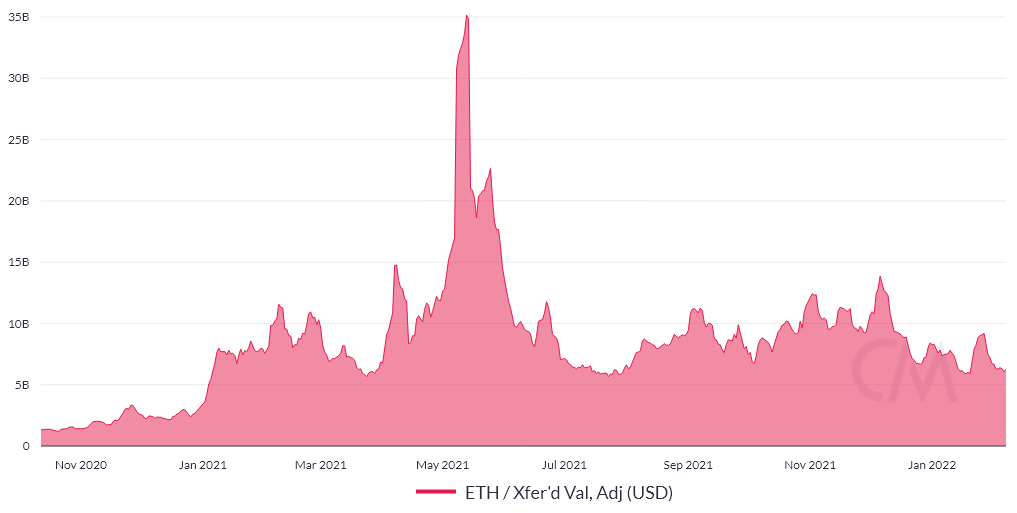
Measuring the monetary value of the ETH transacted on the network provides a reliable indicator of effective use. Of course, this metric could be masqueraded by increasing adoption in layer-2 solutions but it remains a starting point.
Analysts should also check decentralized applications usage metrics. One must remember that the Total Value Locked (TVL) is heavily concentrated on lending platforms and decentralized exchanges (DEX). Consequently, gauging the number of active addresses provides a broader view.

Unless there’s an uptick in Ether transactions and dApps usage metrics, investors will interpret any Ether price move above $3,000 as a potential bull trap. As for retail traders’ neutral funding rate, it might as well be a bullish sign that the investor class typically enters long leverage positions after a strong rally.
The views and opinions expressed here are solely those of the author and do not necessarily reflect the views of Cointelegraph. Every investment and trading move involves risk. You should conduct your own research when making a decision.

Leave A Comment