
Bitcoin (BTC) and most major altcoins sold off along with global equity markets and crude oil on Nov. 26. The markets were roiled on news of a new coronavirus variant detected in South Africa that is worrying scientists due to its large number of mutations in the spike protein.
The sharp fall has resulted in cross-crypto liquidations of over $750 million over the 24-hour period but the funding rates across exchanges remain elevated. This suggests that the selling may not be over yet.

Is the current decline a mouthwatering Black Friday deal or the start of a short-term bear phase? Let’s study the charts of the top-10 cryptocurrencies to find out.
BTC/USDT
The bulls pushed Bitcoin back above the breakdown level at $58,000 on Nov. 25 but they could not clear the barrier at the 20-day exponential moving average ($59,510). This may have attracted profit-booking from traders.

If the price rebounds off this level, the buyers will attempt to push the price above the 20-day EMA. If they succeed, it will indicate that the selling pressure may be reducing.
Alternatively, if the next rebound again turns down from the 20-day EMA, it will indicate that the sentiment has turned negative and traders are selling on rallies. That will increase the possibility of a break below $50,000.
If that happens, the BTC/USDT pair could witness panic selling that may pull the price down to $40,000.
ETH/USDT
Ether (ETH) broke above the 20-day EMA ($4,336) on Nov. 25 but the up-move proved to be a bull trap as the price turned down sharply today and dropped to the neckline of the developing head and shoulders (H&S) pattern.
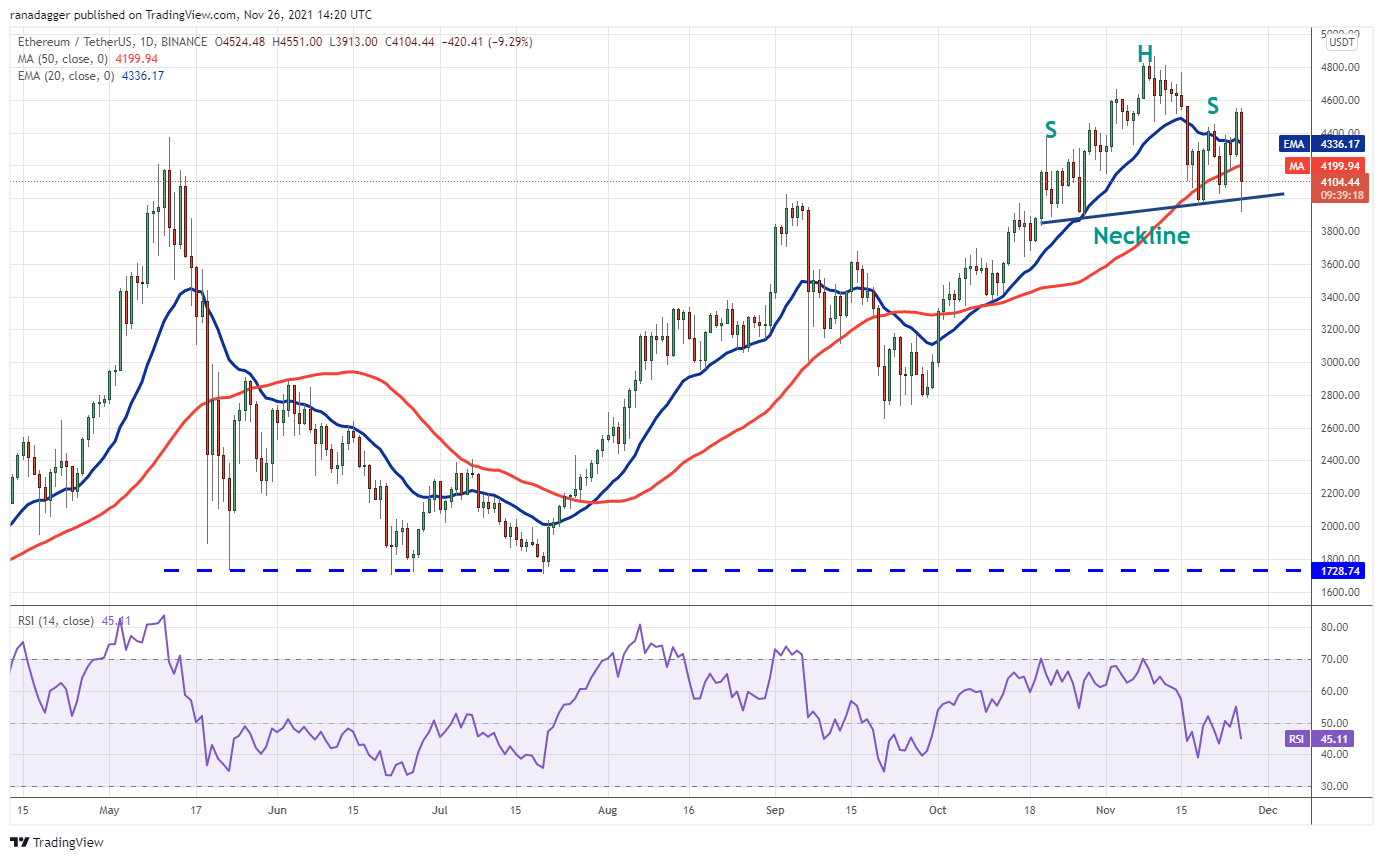
Conversely, a close below the neckline will complete the bearish pattern. That could intensify selling and the ETH/USDT pair could decline to the $3,600 to $3,400 support zone. If this zone also cracks, the next stop could be the target objective at $3,047.
BNB/USDT
Binance Coin (BNB) soared above the overhead resistance at $605.20 on Nov. 25 but the bulls could not clear the strong hurdle at $669.30. This indicates that bears are defending this level with vigor.

A break and close below the 50-day SMA may indicate a trend change. The selling could accelerate on a break below $510. The pair could then drop to $450.
The bulls will have to push and sustain the price above the overhead resistance zone of $669.30 to $691.80 to signal the resumption of the uptrend.
SOL/USDT
Solana (SOL) rebounded off the 50-day SMA ($202) on Nov. 25 but turned down from the 20-day EMA ($216). This suggests a change in sentiment from buy on dips to sell on rallies.

The downsloping 20-day EMA and the relative strength index (RSI) below 43 indicate that bears have the upper hand. This negative view will invalidate if the price turns up from the current level and breaks above the resistance line of the triangle.
ADA/USDT
Cardano (ADA) formed an inside-day Doji candlestick pattern on Nov. 25, indicating indecision among the bulls and the bears. This uncertainty resolved to the downside today with a break below $1.58.

The bulls may attempt a relief rally that is likely to face strong selling at the 20-day EMA ($1.85). If the price turns down from this level, the bears will make one more attempt to sink the pair below $1.50. If they succeed, the pair could drop to $1. The first sign of strength will be a break and close above the 20-day EMA.
XRP/USDT
Although bulls defended the $1 support for the past few days, they could not push XRP above the 20-day EMA ($1.08). This suggests a lack of demand at higher levels.

If they manage to do that, the pair could attempt to gradually move up toward the overhead resistance at $1.24. Conversely, if the price turns down from $1 and breaks below $0.85, the pair could decline to $0.70.
DOT/USDT
Polkadot (DOT) bounced off the uptrend line on Nov. 25 but the bulls could not sustain the higher levels. The selling intensified today and the price dropped below $37.53, completing a bearish H&S pattern.

If the price turns down from this level, it will suggest that the sentiment remains negative and traders are selling on rallies.
Conversely, if bulls drive and sustain the price above $38.70, it will suggest strong demand at lower levels. A break and close above $43.56 could tilt the advantage in favor of the bulls.
Related: BAT price hits new high after 30% daily rally as Basic Attention Token bucks crypto downtrend
DOGE/USDT
Dogecoin (DOGE) attempted a relief rally on Nov. 25 but the long wick on the day’s candlestick shows that bears sold near the downtrend line.
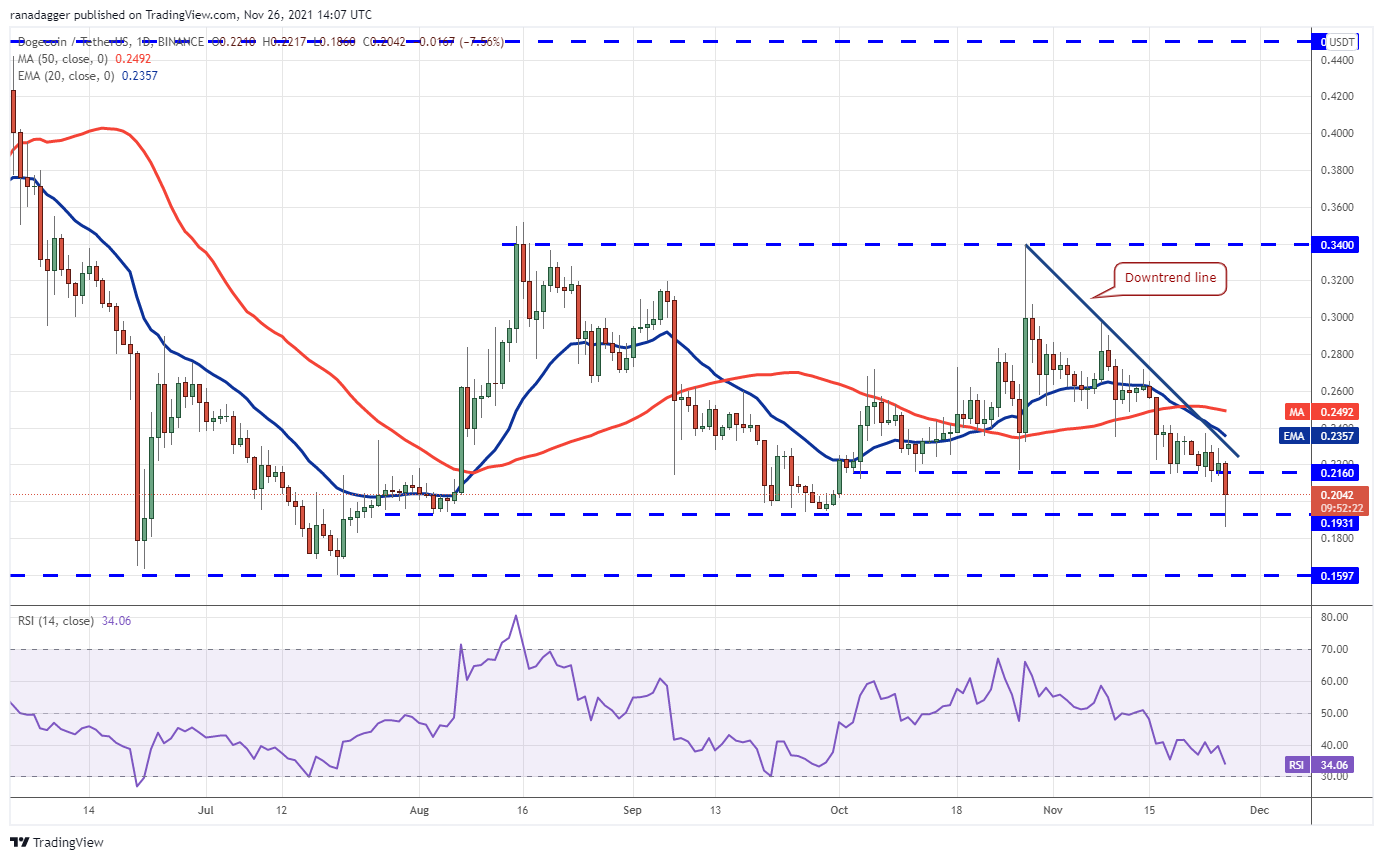
If the price bounces off the current level, the bears will again pose a stiff challenge at $0.21. If this level flips to resistance, the likelihood of a break below $0.19 increases. If that happens, the pair may drop to the critical support at $0.15. The first sign of strength will be a break and close above the 20-day EMA ($0.23).
AVAX/USDT
Avalanche (AVAX) rebounded off the 38.2% Fibonacci retracement level at $112.63 on Nov. 25 but the long wick on the candlestick shows that traders sold on rallies.

Conversely, if bears pull the price below the 20-day EMA and the 50% retracement level at $102.01, the pair could drop to the 61.8% Fibonacci retracement level at $91.39. The deeper the fall, the longer the time it will take for the next leg of the up-move to begin.
SHIB/USDT
SHIBA INU (SHIB) plummeted below the strong support at $0.000040 on Nov. 24. The bulls attempted to push the price back above the level and trap the aggressive bears on Nov. 25 but they could not clear the overhead hurdle at the 20-day EMA ($0.000046).

The SHIB/USDT pair could now complete a 100% retracement and drop to $0.000027. This bearish view will invalidate if the price turns up from the current level and breaks above the 20-day EMA. The pair could then rise to $0.000052.
The views and opinions expressed here are solely those of the author and do not necessarily reflect the views of Cointelegraph. Every investment and trading move involves risk. You should conduct your own research when making a decision.
Market data is provided by HitBTC exchange.

Leave A Comment