
Bitcoin (BTC) rose above $39,000 on Feb. 1 but the sharp fall in the shares of PayPal may have resulted in aggressive selling by the short-term traders.
However, in the long-term, large investors seem to be viewing the decline as a buying opportunity. On-chain monitoring resource Whalemap said that whales holding between 100 to 10,000 BTC have accumulated during the recent decline.
Fidelity recently released a paper dubbed “Bitcoin First” which highlights that Bitcoin is the most “secure, decentralized form of asset” and is unlikely to be overtaken by any of the altcoins “as a monetary good.”
The report said that Bitcoin combines “the scarcity and durability of gold with the ease of use, storage and transportability of fiat.”
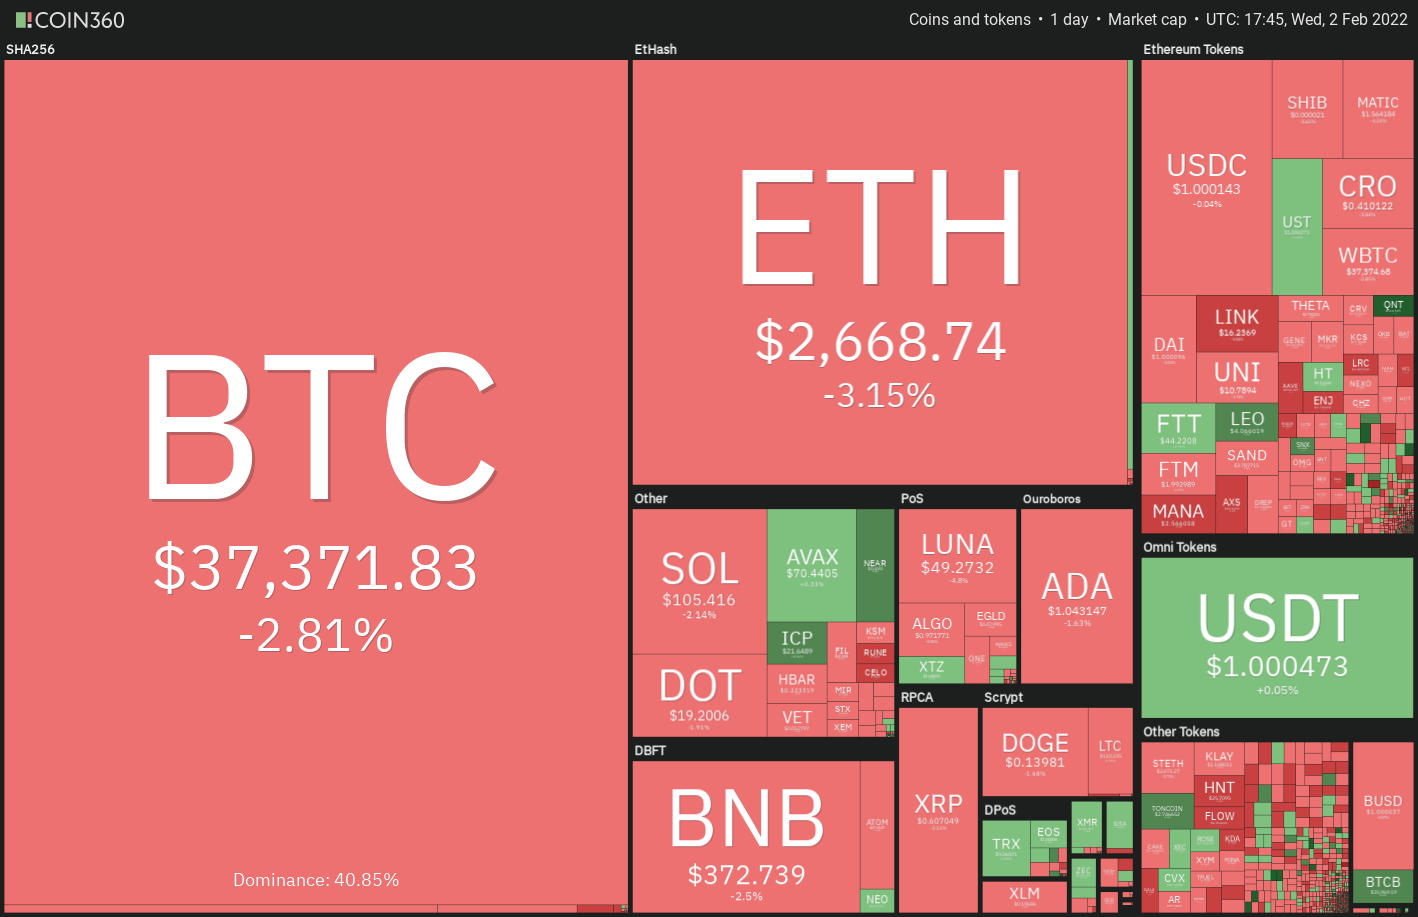
Could the accumulation by the bulls indicate that a bottom may be around the corner? Let’s study the charts of the top-10 cryptocurrencies to find out.
BTC/USDT
Bitcoin’s recovery reached the 20-day exponential moving average ($39,116) on Feb. 1, which is acting as a stiff resistance. This suggests that sentiment remains negative and traders are selling on rallies to the overhead resistance levels.
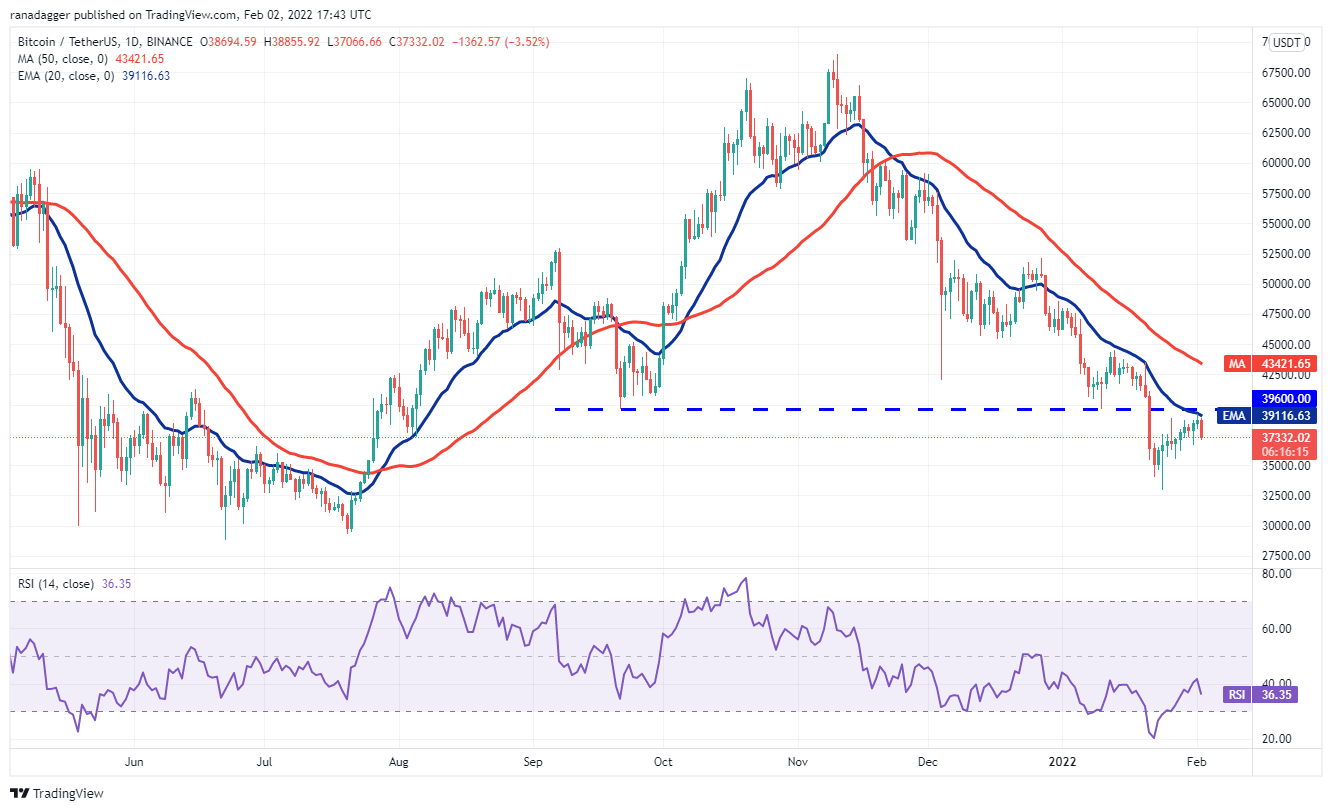
The downsloping moving averages and the relative strength index (RSI) in the negative territory indicate that bears have the edge.
Contrary to this assumption, if the price rebounds off $36,632.61, it will suggest that bulls are buying on dips. They will then make another attempt to clear the overhead hurdle at $39,600.
This is an important level to watch out for because if the pair sustains above this level, the next stop could be the 50-day simple moving average ($43,421). The bulls will have to clear this hurdle to signal a possible end of the downtrend.
ETH/USDT
Ether (ETH) broke and closed above the breakdown level at $2,652 on Jan. 31, but the bulls could not clear the overhead hurdle at the 20-day EMA ($2,792). This suggests that the bears are defending this level aggressively.
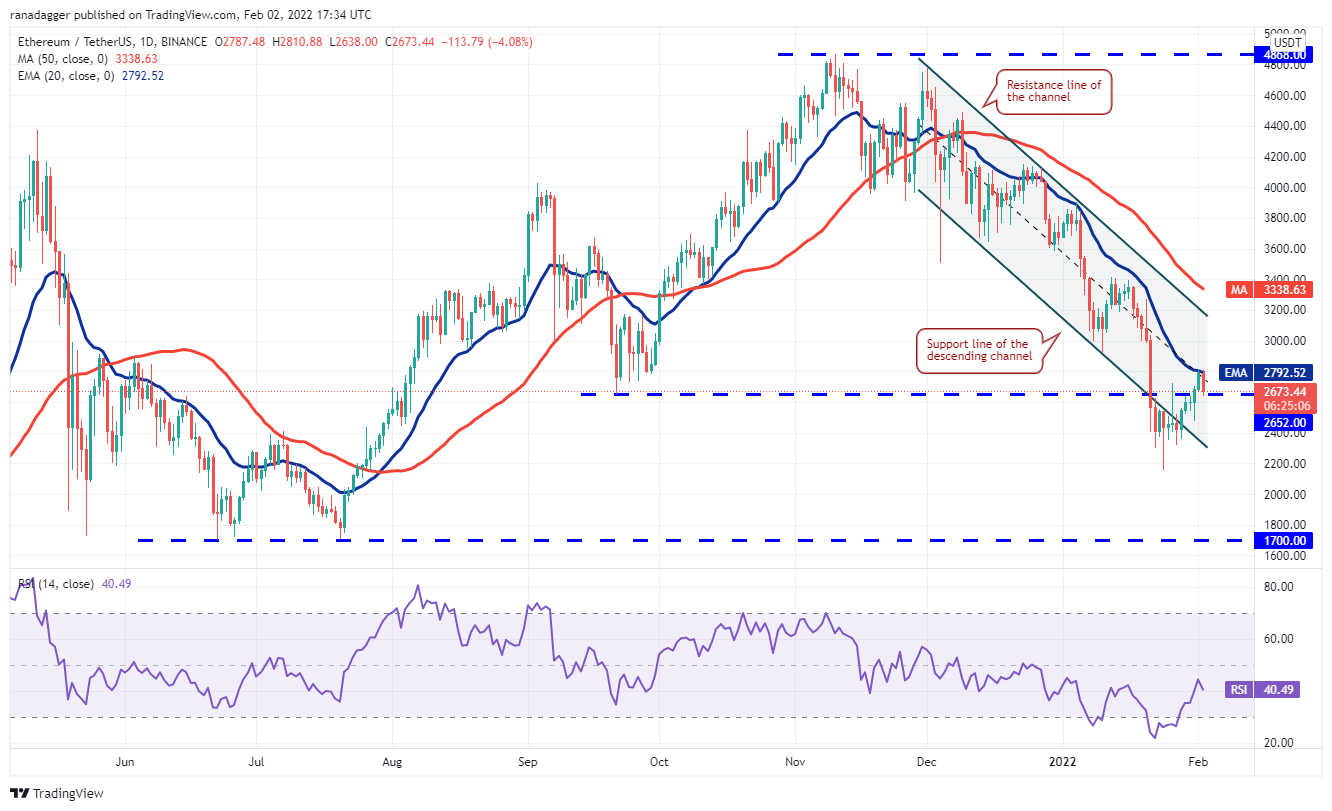
Conversely, if the price rebounds off the current level, it will suggest that bulls are buying on dips. The buyers will then again attempt to push and sustain the pair above the 20-day EMA. If they manage to do that, the pair could start its march toward the resistance line of the channel.
BNB/USDT
Binance Coin (BNB) rebounded off the support line of the channel on Jan. 31, indicating that bulls are buying on dips. However, the bulls could not push the price to the 20-day EMA ($407).
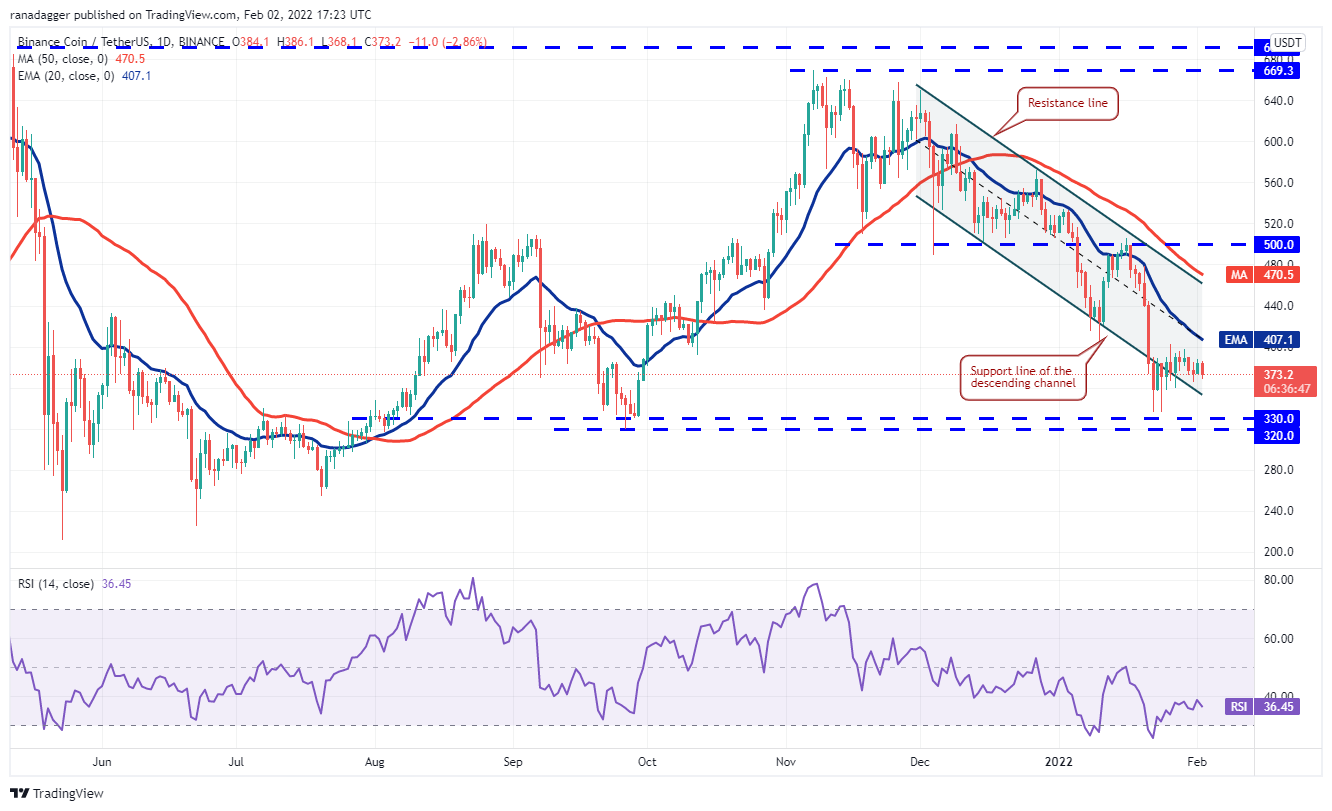
If they succeed, the BNB/USDT pair could drop to the strong support zone at $330 to $320. Alternatively, if the price rebounds off the current level and rises above the 20-day EMA, it will indicate that the selling pressure could be reducing.
ADA/USDT
Cardano (ADA) continues to struggle to rebound off the strong support at $1. This indicates a lack of urgency among traders to accumulate at the current levels.

The first support on the downside is $0.80. If this level cracks, the decline may extend to the support line of the channel. Conversely, a break and close above the 50-day SMA ($1.25) could result in a retest of the resistance line of the channel.
SOL/USDT
Solana (SOL) turned up on Jan. 31 and broke above the overhead resistance at $104.82 on Feb. 1. The price reached the 20-day EMA ($112) today which is acting as a strong resistance.
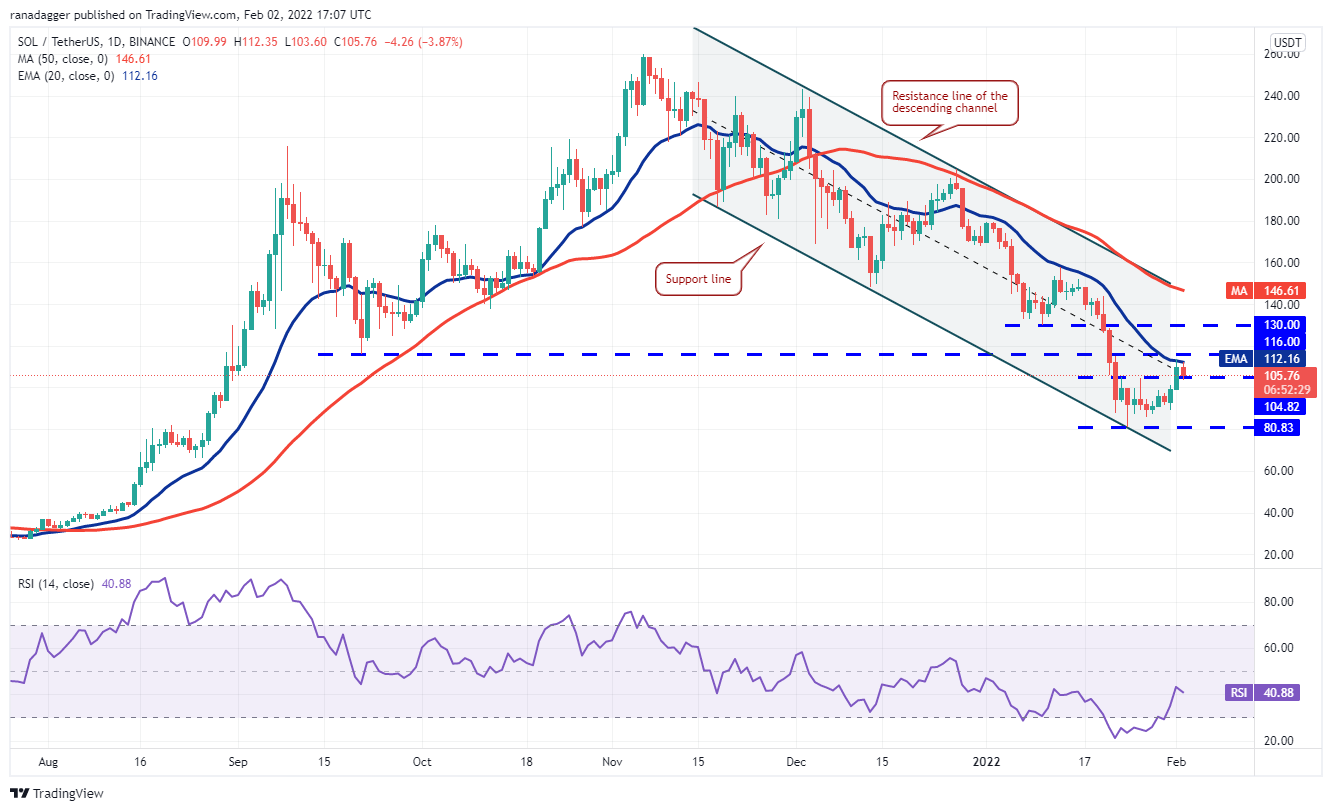
Conversely, if the price rebounds off the current level and rises above $116, it will suggest that bulls are making a comeback. The pair could then attempt a rally to $130 and later to the resistance line of the channel.
XRP/USDT
Ripple (XRP) remains stuck between $0.54 and $0.65. The attempt by the bulls to start a relief rally could not even challenge the overhead resistance at $0.65. This indicates a lack of conviction among the bulls to buy at higher levels.
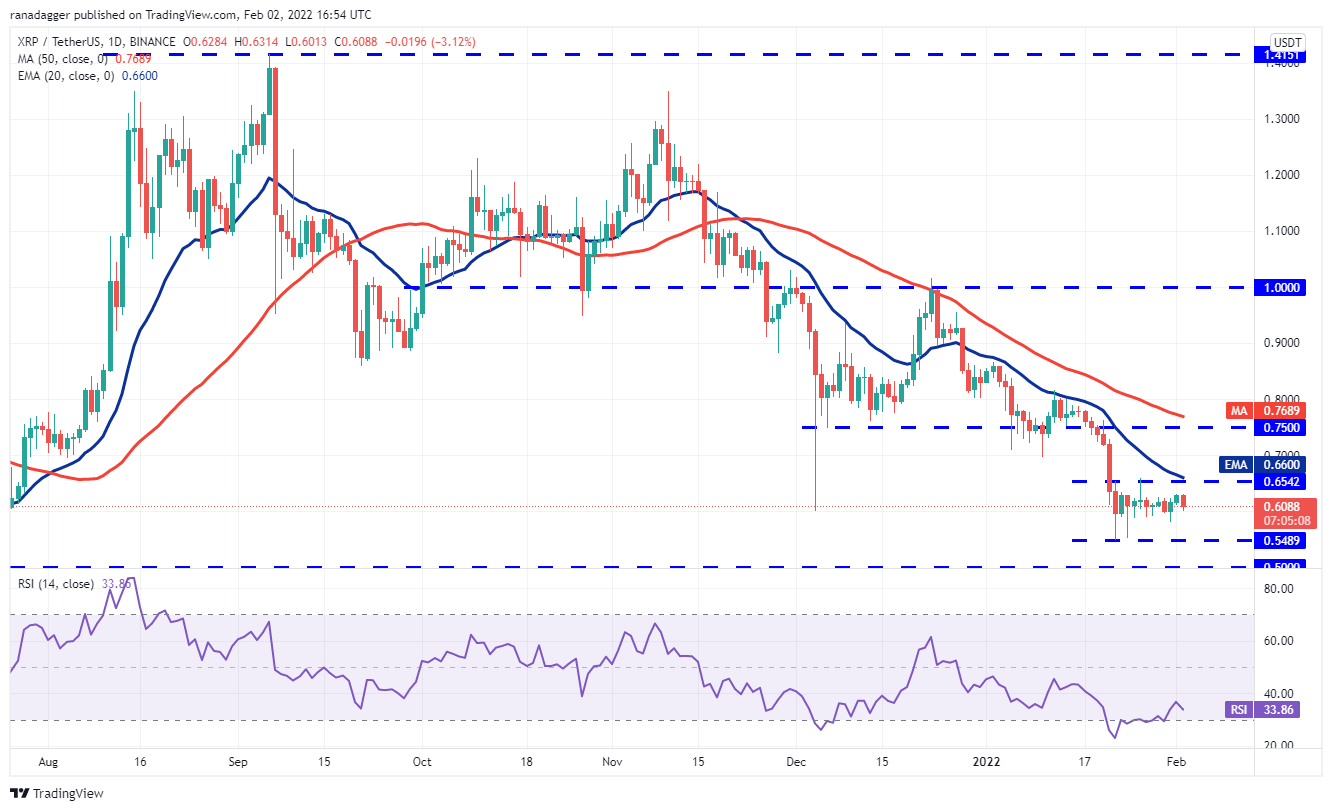
A break and close below this level could pull the pair to the psychological support at $0.50. This negative view will invalidate in the short term if the price turns up from the current level and breaks above the 20-day EMA ($0.66).
LUNA/USDT
Terra’s LUNA token bounced off the support line of the descending channel on Jan. 31 but made a Doji candlestick pattern on Feb. 1. This indicates that demand dried up at higher levels.
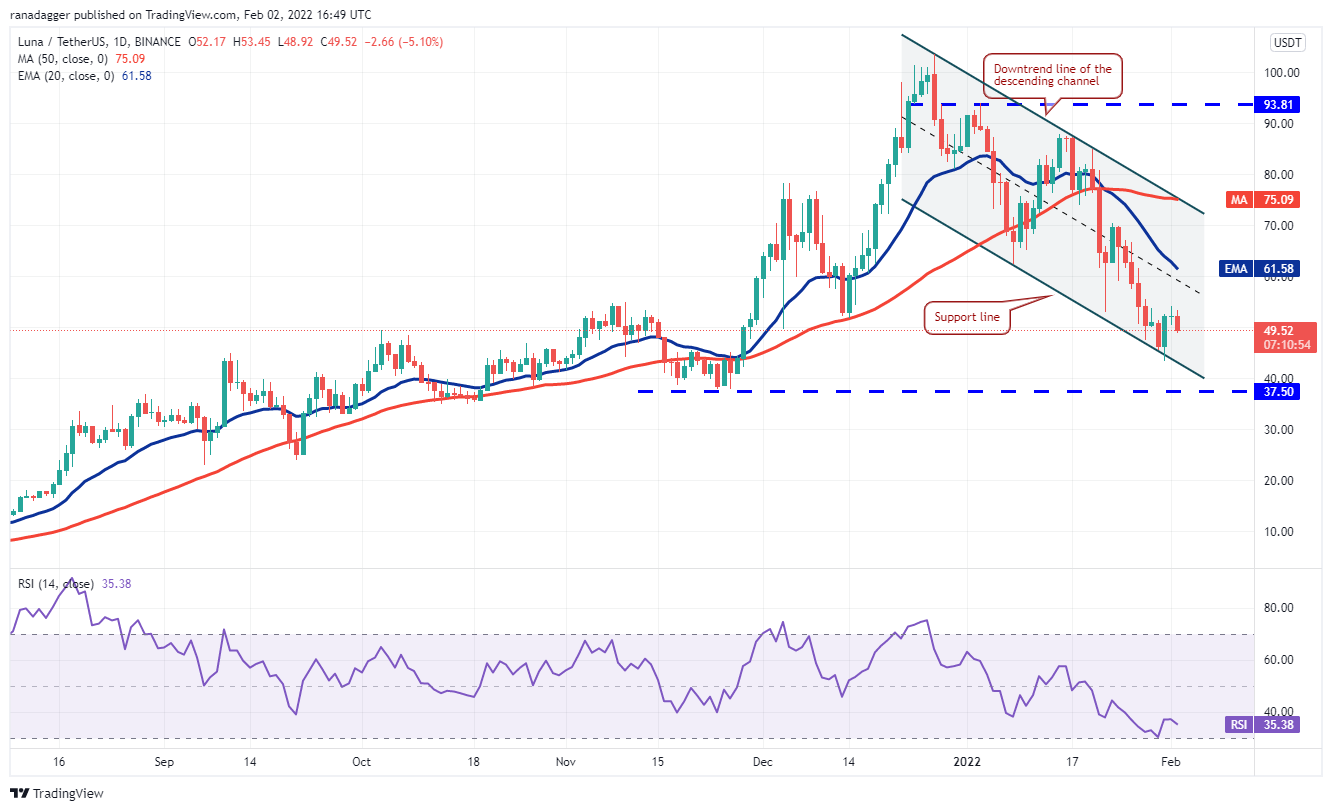
If the price turns up from the current level and breaks above $54.20, it will suggest that bulls are accumulating on dips. The LUNA/USDT pair could then reach the 20-day EMA which may act as a barrier. A break and close above this resistance will be the first indication that the bears may be losing their grip.
Related: Why did WazirX token (WRX) jump 30% after India announced its big crypto tax?
DOGE/USDT
Dogecoin (DOGE) remains stuck between $0.13 and $0.15 for the past few days. After failing to break below the support, the price rose to the 20-day EMA ($0.14) which is acting as a stiff resistance.
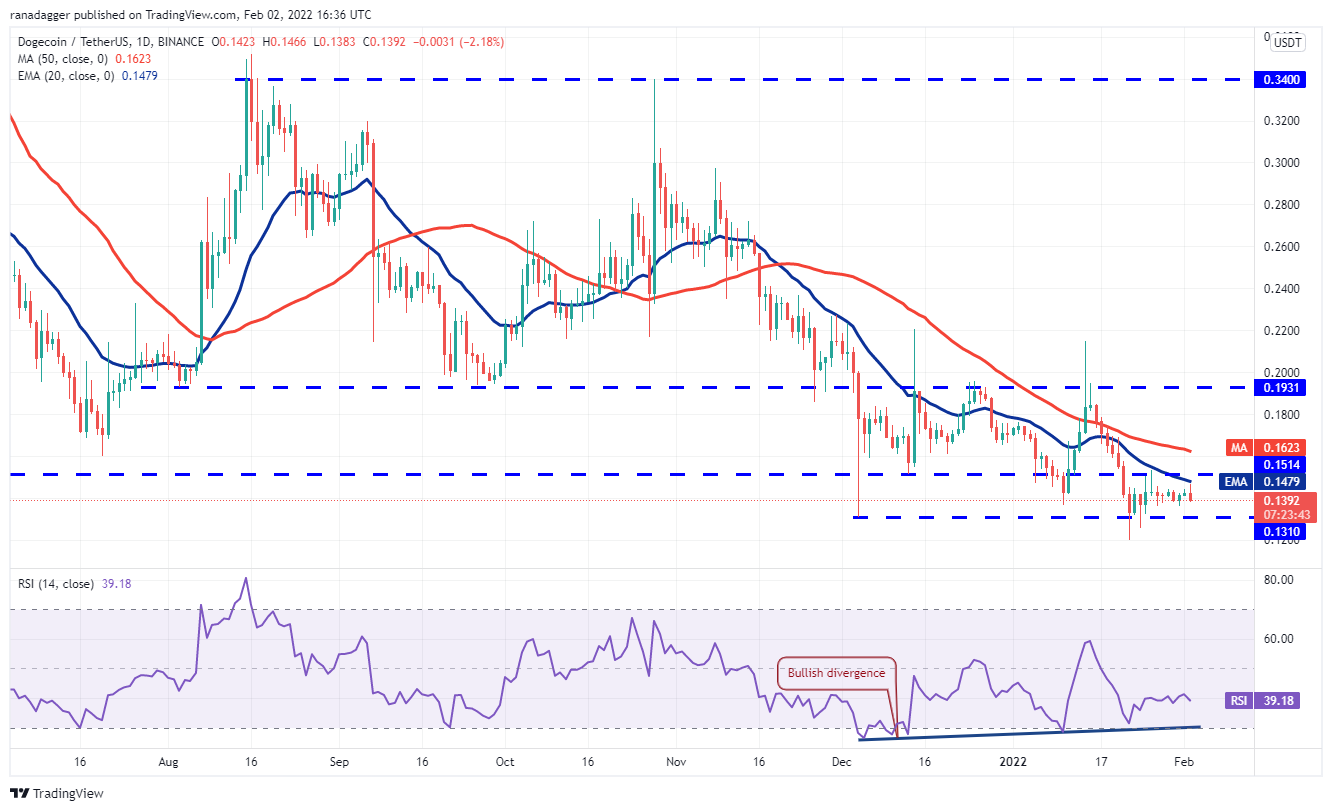
If the price slips and sustains below $0.13, the next stop could be $0.10. Conversely, if the price rebounds off $0.13, the pair could extend its range-bound action for a few more days. The bulls will have to push and sustain the price above the 50-day SMA ($0.16) to signal a possible change in trend.
DOT/USDT
The failure of the bears to pull Polkadot (DOT) below the strong support at $16.81 in the past few days could have attracted buying from the aggressive bulls. This started a relief rally which reached the 20-day EMA ($20.74).
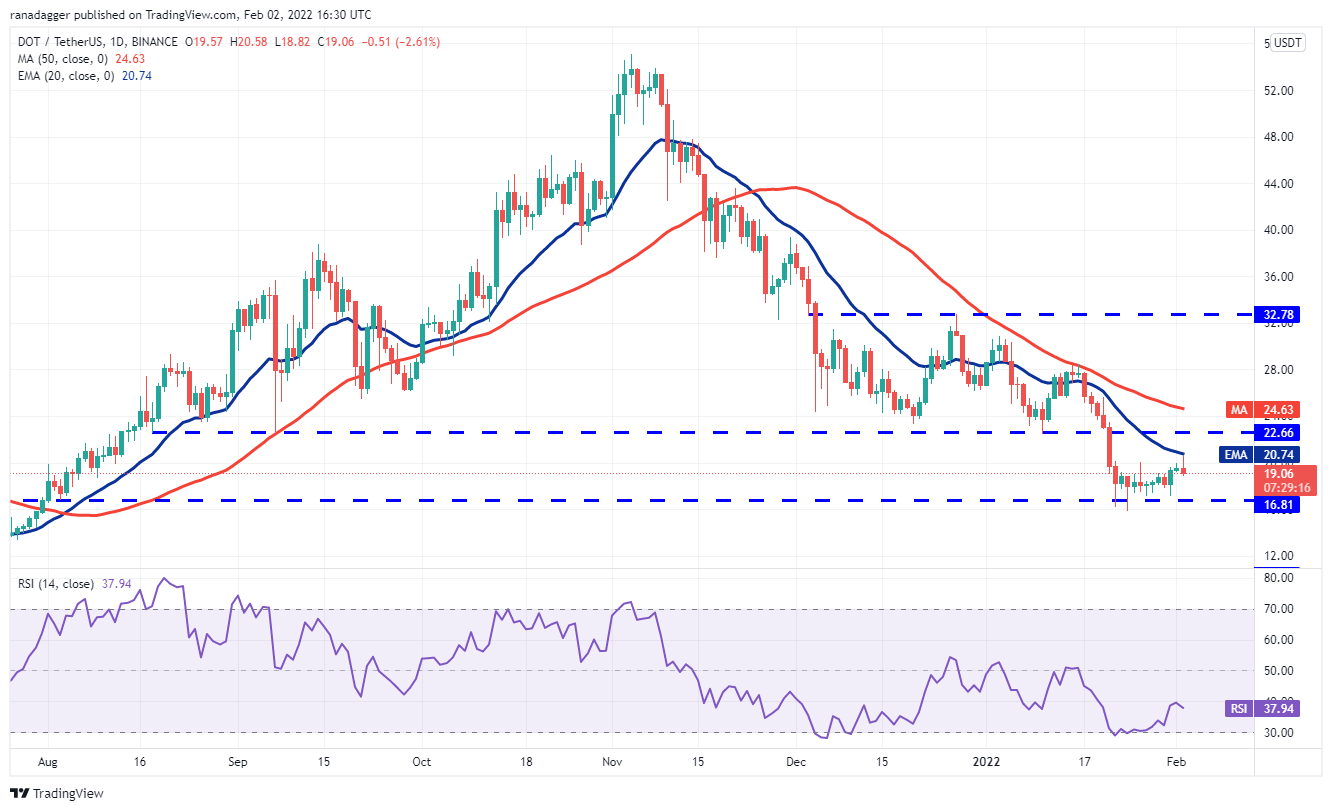
If that happens, the downtrend could resume and the DOT/USDT pair may drop to the next important support at $10.37.
Contrary to this assumption, if the price turns up from the current level and breaks above the 20-day EMA, the pair could rise to the 50-day SMA ($24.63).
AVAX/USDT
Avalanche’s (AVAX) relief rally stalled near the breakdown level at $75.50, indicating that the trend remains down and bears are trying to assert their dominance.
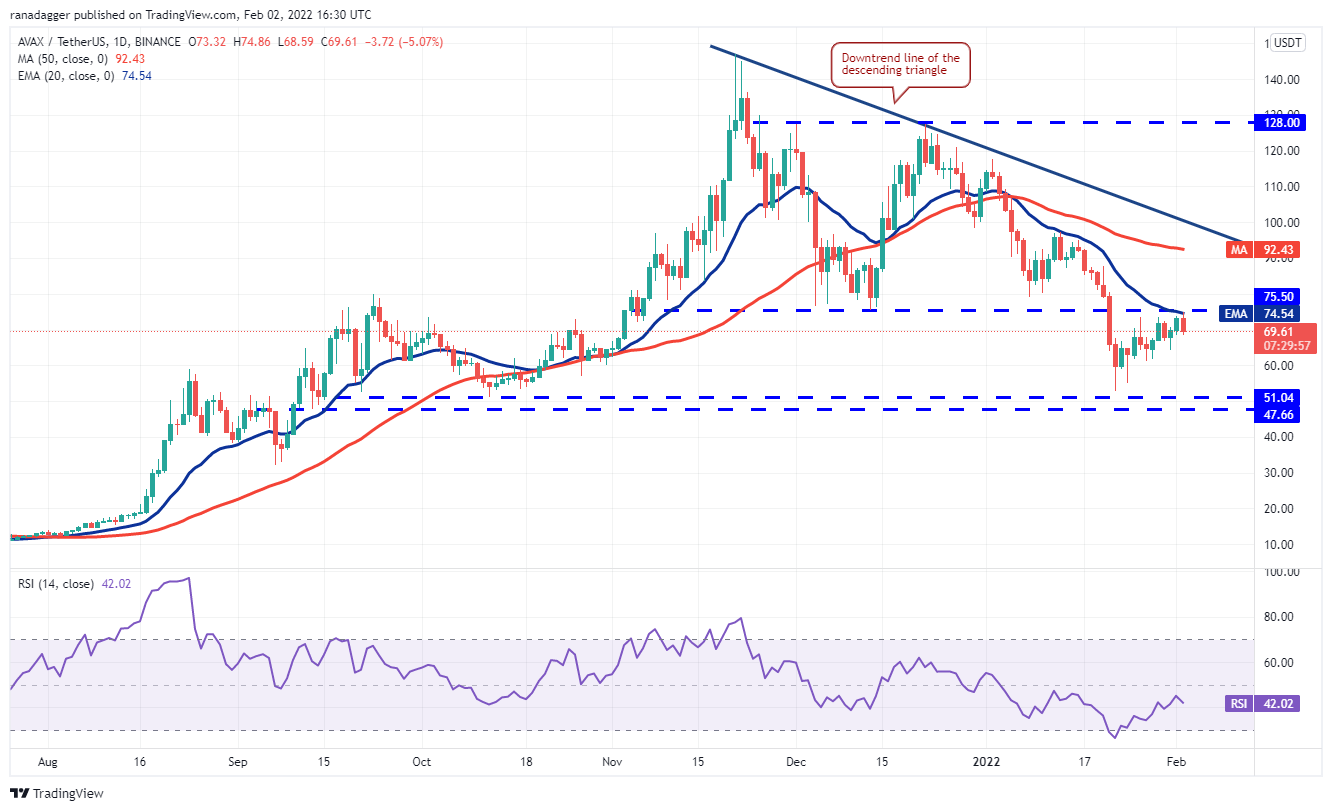
On the other hand, if the price turns up from the current level, the bulls will make one more attempt to push the price above the overhead resistance at $75.50. If they manage to do that, the pair could rally toward the downtrend line of the descending triangle.
The views and opinions expressed here are solely those of the author and do not necessarily reflect the views of Cointelegraph. Every investment and trading move involves risk. You should conduct your own research when making a decision.
Market data is provided by HitBTC exchange.

Leave A Comment