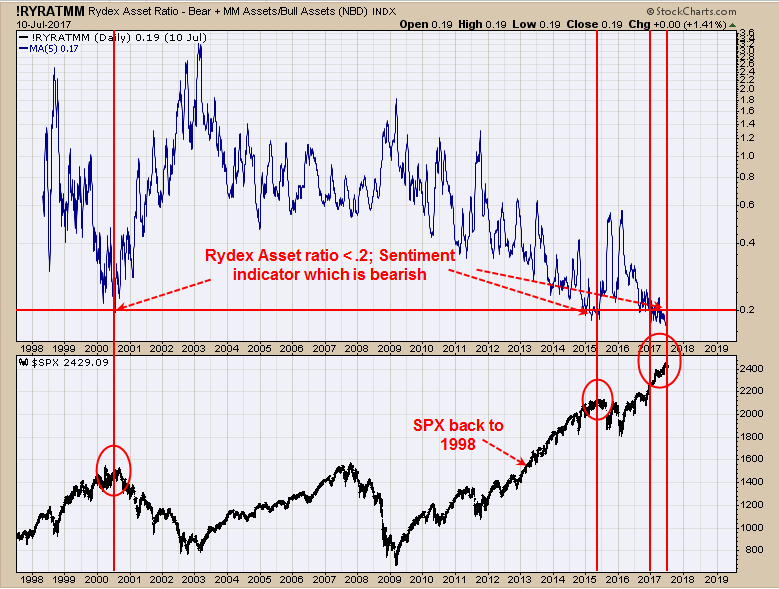
SPX Monitoring purposes; Covered short on 7/6 at 2409.75=gain 1.2%; Short SPX 6/26/17 at 2439.07 Monitoring purposes Gold: Neutral Long Term Trend monitor purposes: Neutral Above is a sentiment indicator; which is the Rydex Asset Ratio minus bear funds plus
July 11, 2017

Podcast: Play in new window | Play in new window (Duration: 13:15 — 7.6MB) DOW + 0.55 = 21,409 SPX – 1 = 2425 NAS + 16 = 6193 RUT + 4 = 1413 10 Y – .01 = 2.36% OIL + .70 =

Will there ever be another correction? An absurd question to be sure, but one I’m fielding with increasing frequency these days. Why? It’s been more than a year since the S&P 500 declined as much as 5% from a prior
Janet Yellen gave testimony to Congress today which caused equity, bond and gold futures to all rally. Although her comments were more dovish than many expected, it’s hard to put much faith in them longer term when her job is
Most active equity options and strikes for the end of day, July 11, 2017
What effect will Fed balance sheet normalization have on Treasury yields? That’s quickly becoming something of an obsession for market participants and rightfully so. After all, no one (least of all the Fed itself) has any idea how this is

We discuss Housing & Real Estate news covering Norway and London all the way back to Mortgage news in the United States in this video. Bubbles pop in Real Estate just like all other Financial Assets. It was thought that

The infamous “E*Trade baby” debuted during the January 2008 Super Bowl. At the time, the S&P 500 was an un-alarming 10% off its peak… but it was about to slide another 42% lower over the following 13 months. E*Trade’s message
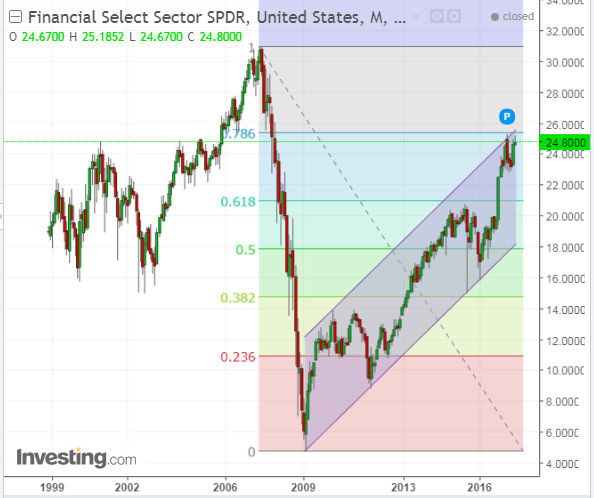
The following Monthly chart of XLF shows that current price is up against major long-term Fibonacci, channel and price resistance. The Daily ratio chart below of XLF:SPX also shows that price is up against major short-term price resistance. The year-to-date percentages-gained graph below shows that XLF has been holding its own, so
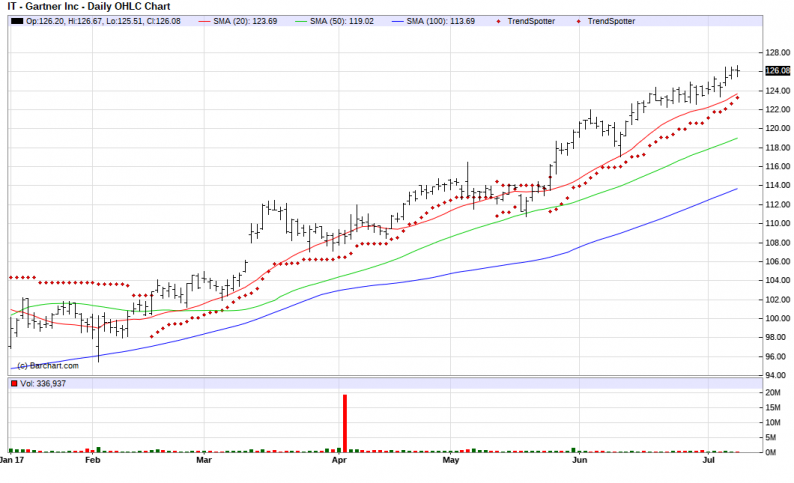
The Chart of the Day belongs to Gartner (IT). I found the management consulting stock by using Barchart to sort the S&P 500 Large Cap Index stocks first by the most frequent new highs in the last month, then again by technical buy signals of 80%