We’re going to dedicate another article to re-discovering the relationship between the 10-year bond and the stock market. With bond yields skyrocketing in the 4th quarter of 2017 and the first 2 months of 2018, it’s more important now than ever to understand the relationship. The confusing aspect, which started during the correction in early February 2018, is that the financial media headlines blame yields going up for the stock market decline, but the yields and stocks often act in correlation. In a previous article, we discussed that historically when the 10-year bond yield gets to 5%, stocks start declining when yields higher. The addendum to that point was that, based on recent action, it was concluded 3.5% was the new marker.
Does Historical Correlation Matter?
The criticism of looking at the dot plot of 2-year correlations between the S&P 500 and the 10-year treasury yield based on daily changes is that the chart is only based on a few different cycles. Back in the 1970s, the Fed was fighting inflation with high rates. When rates fell, there was a recession. The bond market has been in a bull market for about 4 decades. Even though there are many data points in the chart, bond yields have been going in one direction for most of it. It’s possible that if the yield increased, breaking out of its downtrend, the relationship could change.
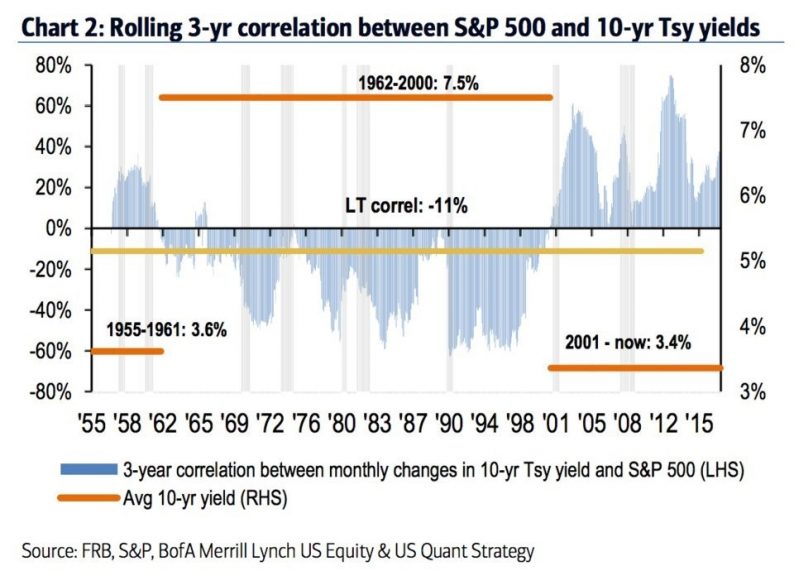
The chart below gets at this point as it shows the 3-year correlation between the 10-year yield and the S&P 500.

Treasury Yield & S&P 500 Correlation In 3 Regimes
It labels the average 10-year yield in 3 different regimes. In the 1955-1961 regime, the average yield was 3.6%. In the 1962-2000 regime, the average yield was 7.5%. the current regime which lasts from 2001 until today has an average yield of 3.4%. As you can see from the correlations, the average is -11%. There tends to be a positive correlation when yields are low and a negative correlation when yields are high. Therefore, looking at all the regimes together ruins the data. Obviously, the key point is figuring out which regime we’re headed into. Just because yields are low now, doesn’t mean yields will be low in the next 5 years.


Leave A Comment