S&P 500 Index (SPX ) 2431.77 declined 7.30 or – 30% for the week after making a new intraday high at 2446.20 Friday before reversing to close 2.02 lower. From a technical perspective, Friday’s key reversal and outside range day forecast lower lows the next trading session and since few other indicators have turned negative the decline could be limited to technology and semiconductors and may not last long.
CBOE Volatility Index® (VIX) 10.70 advanced .95 or +9.74% for the week while the comparable IVolatility Implied Volatility Index, IVXM now 7.50 advanced .50 or +7.14%.
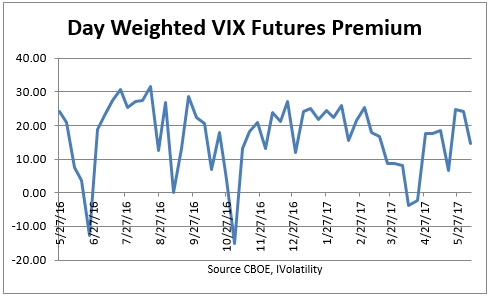
VIX Futures Premium
The chart below shows as our calculation of Larry McMillan’s day-weighted average between the first and second months.
With 7 trading days until the June expiration, the day-weighted premium between June and July allocated 28% to June and 72% to July for a premium of 14.75%, still in a bullish green zone as the VIX closed higher Friday.

The premium measures the amount that futures currently trade above or below the cash VIX, (contango or backwardation) until front month future converges with the VIX at expiration.
Following the lead of the “Algo Rotators” as they suddenly switched from technology and semiconductors to energy and financials requires putting fundamentals aside and focusing on technical levels while carefully watching for an another abrupt reversal. On the presumption that Friday’s SPX decline suggests it will likely continue lower for a few days while the oversold sectors continue to advance here is a short-term counter-trend trade idea for nimble traders to consider.
SPDR S&P Oil & Gas Exploration & Production ETF (XOP) 32.61 up .29 or +.9% for the week after advancing 1.18 Friday from an intraday low of 31.37 Thursday. With the most options volume and open interest compared to other ETFs in the oversold oil & gas sector means more liquidity and closer bid/ask spreads.
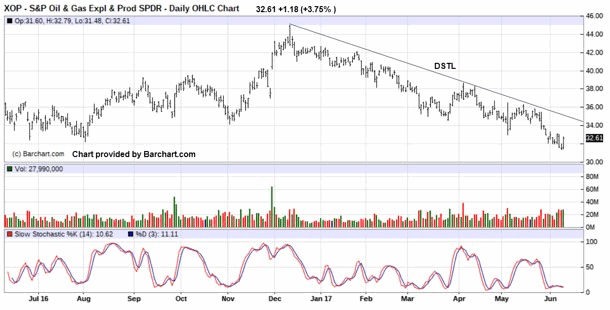
The current Historical Volatility is 30.61 and 30.02 using the Parkinson’s range method, with an Implied Volatility Index Mean of 29.18 up from 28.90 the week before now .30 of the 52-week range between the high of 45.15 on November 29, 2016 and the low of 22.39 on January 27. The implied volatility /historical volatility ratio using the range method is .97 so option prices are relatively inexpensive compared to the recent movement of the stock, but the implied volatility is likely to decline as the ETF advances. Friday’s option volume was 219,050 contracts traded compared to the 5-day average volume of 213,240. Consider this long call spread with a short put.


Leave A Comment