As forecasted by our research Team, Ripple Broke out. With a spectacular upwards move, Ripple price went from 0.30 USD to touch 0.90. In our Ripple price forecast for 2018, we mentioned the following:
“Our Investinghaven price prediction for Ripple is that once all weak hands have sold (near 0.30) we will witness a strong XRP performance. With the next attempt to break higher, there will be critical mass in the number of buyers, and Ripple price will double and possibly triple in a matter of weeks in 2018.”
With the recent price movement, our forecast has materialized and we published shortly after that Ripple price will continue to rise and likely hit the 2.50 USD in 2018.
Our article today will cover 3 reasons why we believe Ripple’s breakout in December 2017 is just the beginning of what could be a mega breakout for Ripple price.
Ripple chart Setup signals more upside ahead
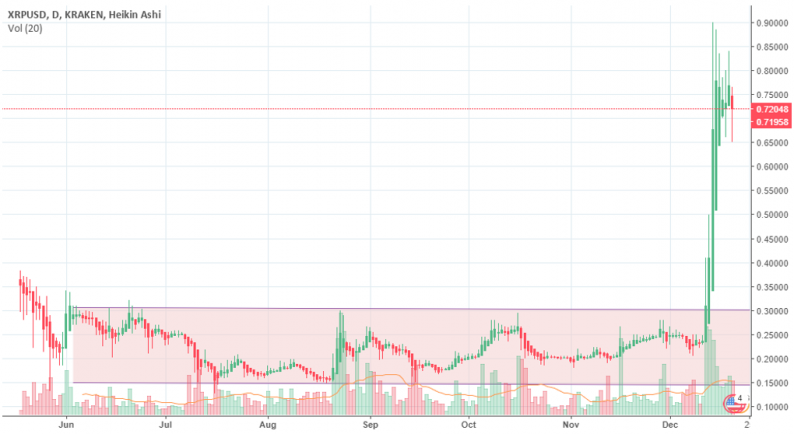
The most up to date Ripple chart shows a major Bull flag. The Bull flag is the result of the fast and strong price action from last week. This type of price action is exactly what we expected because of the extremely long consolidation that took place prior to the Breakout.

In fact, ripple price was range bound between 0.13 and 0.35 for most of 2017. This made it perfect for short term trading which explains the quick and sharp selloffs.
Zooming out, we can see on the below chart that from December 2016 till April 2017, Ripple price was in range bound as well until it broke out. That Breakout was followed by the recent consolidation between 0.15 to 0.35 USD between June and December 2017.
This pattern leads us to believe that the logical move for Ripple price early 2018 is a consolidation between 0.64 and 0.84 which will be followed by the materialisation of our 2.50 price target. The difference this time is that the consolidation might be shorter than the previous ones. Catalysts are lining up for Ripple price and they will be directly related to its intrinsic value.


Leave A Comment