
AT40 = 57.2% of stocks are trading above their respective 40-day moving averages (DMAs)
AT200 = 57.6% of stocks are trading above their respective 200DMAs
VIX = 11.2 (volatility index)
Short-term Trading Call: cautiously bullish
Commentary
The cats were particularly frenetic in the last week of trading for the second quarter of 2017.

The cats are frenetically grasping at balls of yarn.
The major indices made some major moves, but it was hard to get a handle on why these moves happened. Why was the market a nut job in one direction one day, and then a nut job in the exact opposite direction the next day? The major indices swung wildly up and down and up and down and up and down again. Sure, I could cherry pick a good news item or a bad news item on any given day and force feed a correlation, but I think such an exercise is much less important than the end results. The simplest explanation is best: the market is fighting to make an adjustment that may remain unclear until we have sufficient hindsight.
The Bond Market
Interest rate dynamics may provide a good source for the churn. Long-term rates marched higher all week. For example, the iShares 20+ Year Treasury Bond ETF (TLT) declined each day of the week after gapping down significantly on Monday. The contrary gap UP created by the Fed’s last rate hike has almost filled.
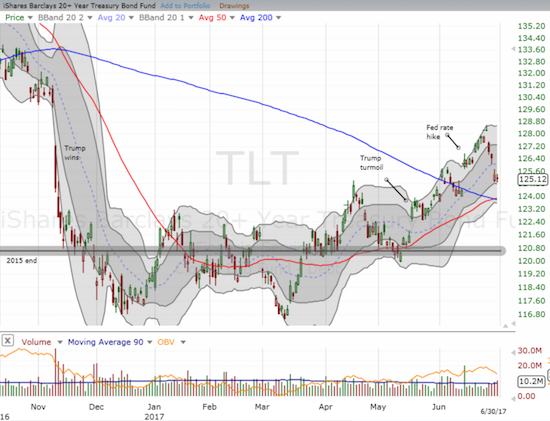
It took two weeks but interest rates are finally headed in the expected direction after the Fed’s last rate hike. The iShares 20+ Year Treasury Bond ETF (TLT) has almost reversed its (contrary) gain from the Fed’s rate hike.
The 30-Day Fed Fund Futures confirmed the move in rates by reverting back to timing the next Fed rate hike for December.
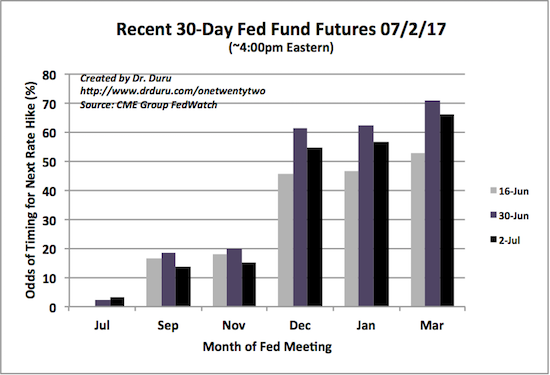
Two days after the Fed hiked rates, the market barely expected the next rate hike to occur in March, 2018. Now, the market has flipped right back to December.
Source: CME FedWatch Tool
June 16th was two days after the Fed hiked interest rates and announced its plan to start reducing teh size of its balance sheet. Note that July 2nd is the time of writing, and the CME updated its market data past Friday, June 30th. The large drop in odds since Friday suggests the market rushed to an extreme last week. I will be watching to see what unfolds in the coming and more.
Forex
Strangely enough, the higher rates and rate expectations did not help the U.S. dollar index (DXY0) as stronger forex forces beyond the dollar dominated. This absence of the usual correlation likely added to the chaotic behavior of stocks, especially the big caps that have significant international exposure. The Fed has hiked rates three times in the last 6 months, yet the dollar sits at a 9-month low.
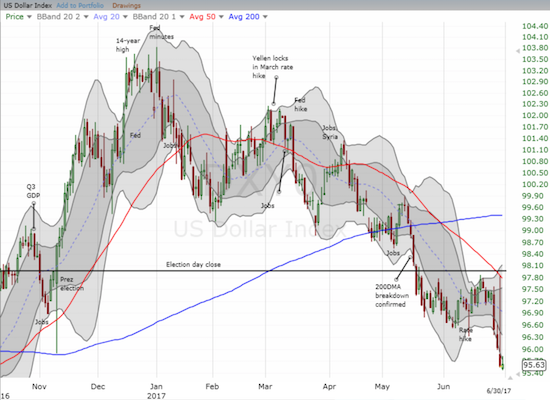
The U.S. dollar index (DXY0) confirmed a fresh breakdown to end the month of June.
With these breakdown in correlations and flip-flopping about the impact of Fed rate hikes, no wonder the stock market was so sensitive and frenetic.
Stock indices
In my last Above the 40 post (for Wednesday June 28th), I marveled at the market’s immediate healing process that erased most of the damage from the previous day’s selling. In particular, the 50DMAs on the Nasdaq and the PowerShares QQQ ETF (QQQ) held as support, and the S&P 500 (SPY) completely reversed its losses. AT40 (T2108), the percentage of stocks trading above their respective 40DMAs, confirmed the rapid return to bullish pastures. The technical picture deteriorated from there and into the close of the week.


Leave A Comment