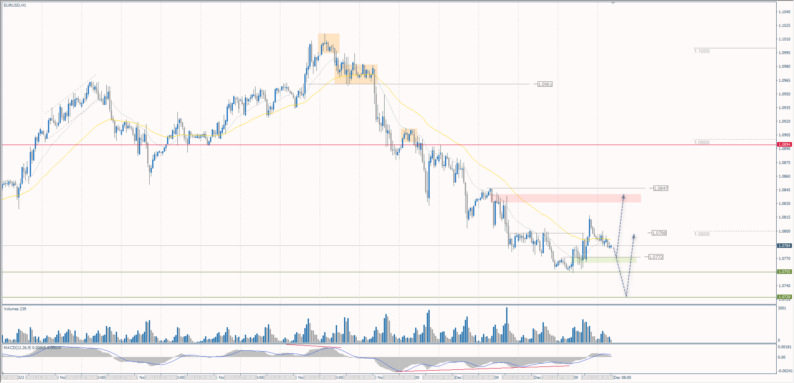
The EUR/USD currency pairTechnical indicators of the currency pair:
The euro initially fell to a 3-week low on Thursday after an unexpected drop in German industrial production in October pushed German 10-year bond yields to an 8-month low. However, the euro rose moderately towards the end of the trading session as dollar weakness triggered short covering in EUR/USD. The European Statistical Office confirmed an estimate that gross domestic product (GDP) in the eurozone contracted by 0.1% in the third quarter compared to the previous three months. Surveys suggest that the ECB will start cutting rates in the second quarter of next year, earlier than previously thought, as the economy enters a short and shallow winter recession.Trading recommendations
The trend on the EUR/USD currency pair on the hourly time frame has changed to a downtrend. Yesterday, buyers showed a reaction from the support level of 1.0772 and broke through the nearest support level. Given the divergence on MACD, there is a high probability of a rise to 1.0847, but remember the NonFarm report, which will greatly increase volatility and could lead to a quick test of 1.0728 to grab more liquidity. Selling can be looked for from the 1.0847 resistance level. Buying can be considered from 1.0772 or 1.0728, but we need to be careful with stop-loss placement as volatility can get caught in the tail.Alternative scenario: if the price breaks the resistance level at 1.0894 and consolidates above it, the uptrend will likely resume. 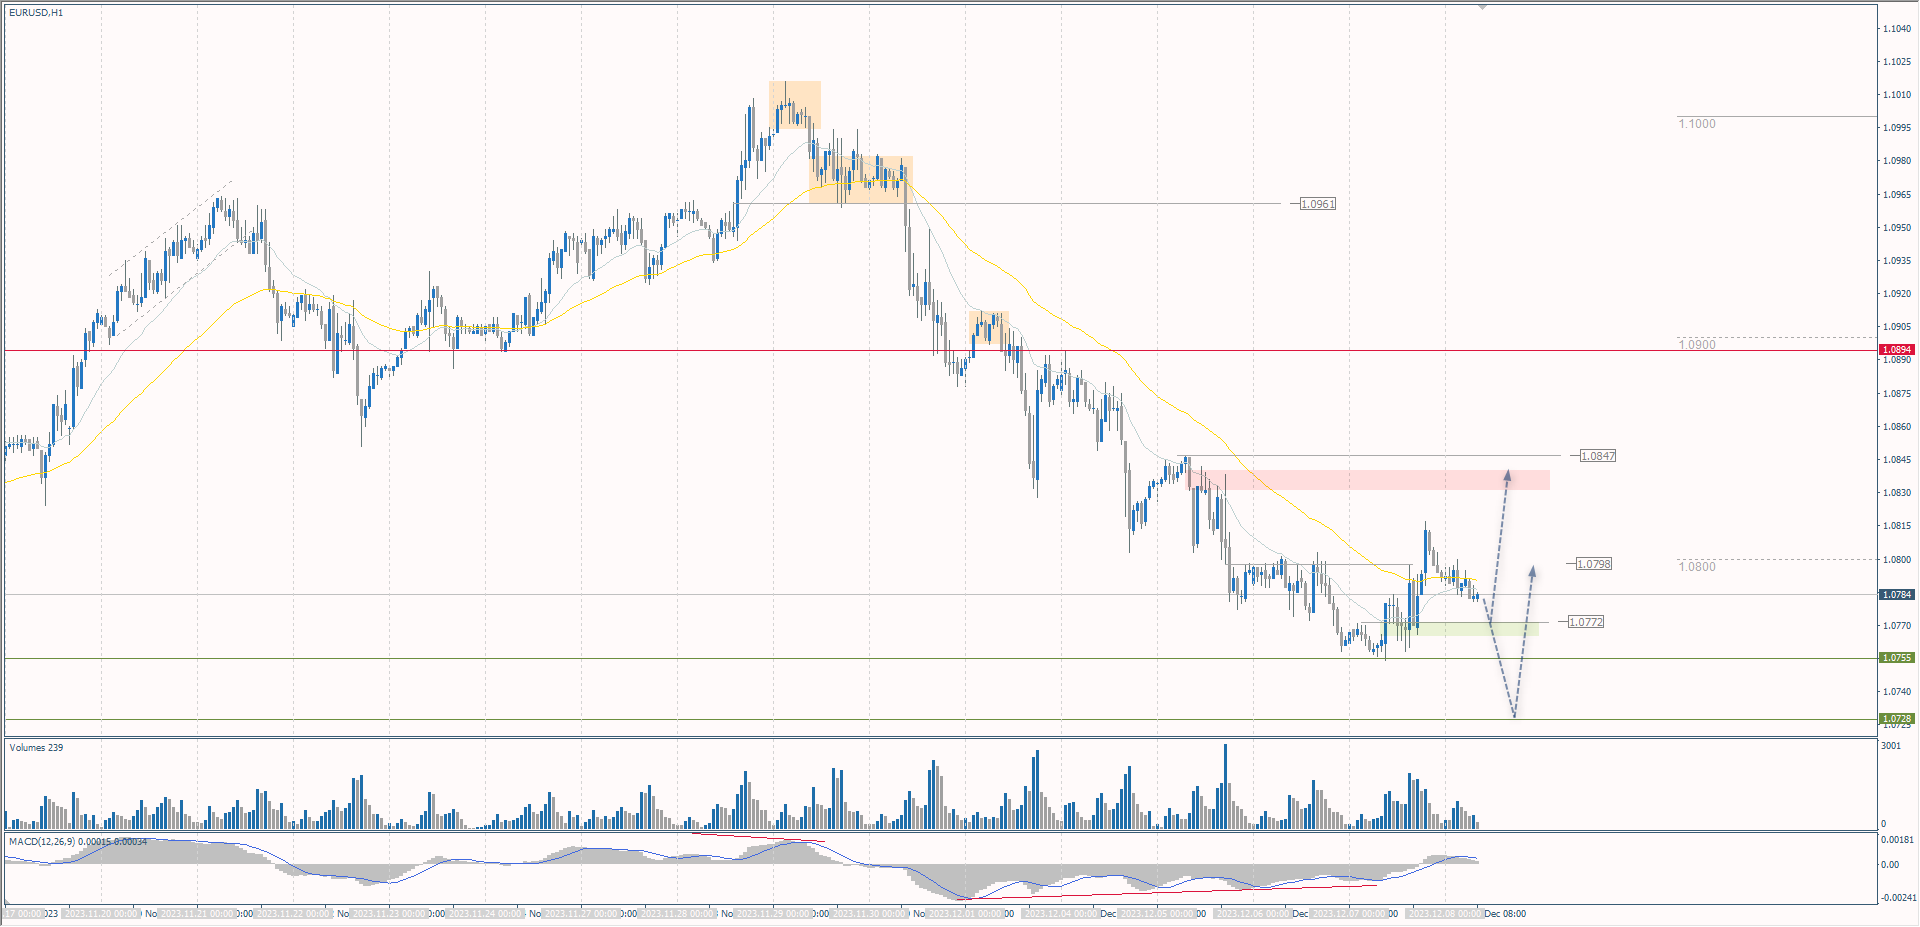 News feed for 2023.12.08:
The GBP/USD currency pairTechnical indicators of the currency pair:
So far, market reassessment has been less aggressive for the Bank of England. Investors expect three rate cuts next year, compared to more than five from the ECB. The first-rate cut from the Bank of England is expected in June, while the ECB is likely to start from March-April. The Bank of England will hold a monetary policy meeting next week. Analysts are predicting that policymakers will vote to keep the rate on hold, with the three hawks on the committee voting again in favor of another 25 bps rate hike, giving us a repeat vote of 6-3. The same hawkish outlook is expected as last time, including a line on keeping rates restrictive for an extended period.Trading recommendations
From the point of view of technical analysis, the trend on the GBP/USD currency pair on the hourly time frame is bearish. Yesterday, buyers took the initiative from the support level of 1.2543, after which the price reached the resistance level of 1.2612. The divergence is fully filled, so the price is likely to flat until the publication of the US labor market news. Selling can be looked for from the resistance level of 1.2612 or on a stronger rise of 1.2651. Buying is best looked for from level 1.2567, with a spike on the news — from 1.2525.Alternative scenario: if the price breaks the resistance level of 1.2651 and consolidates above it, the uptrend will likely resume. 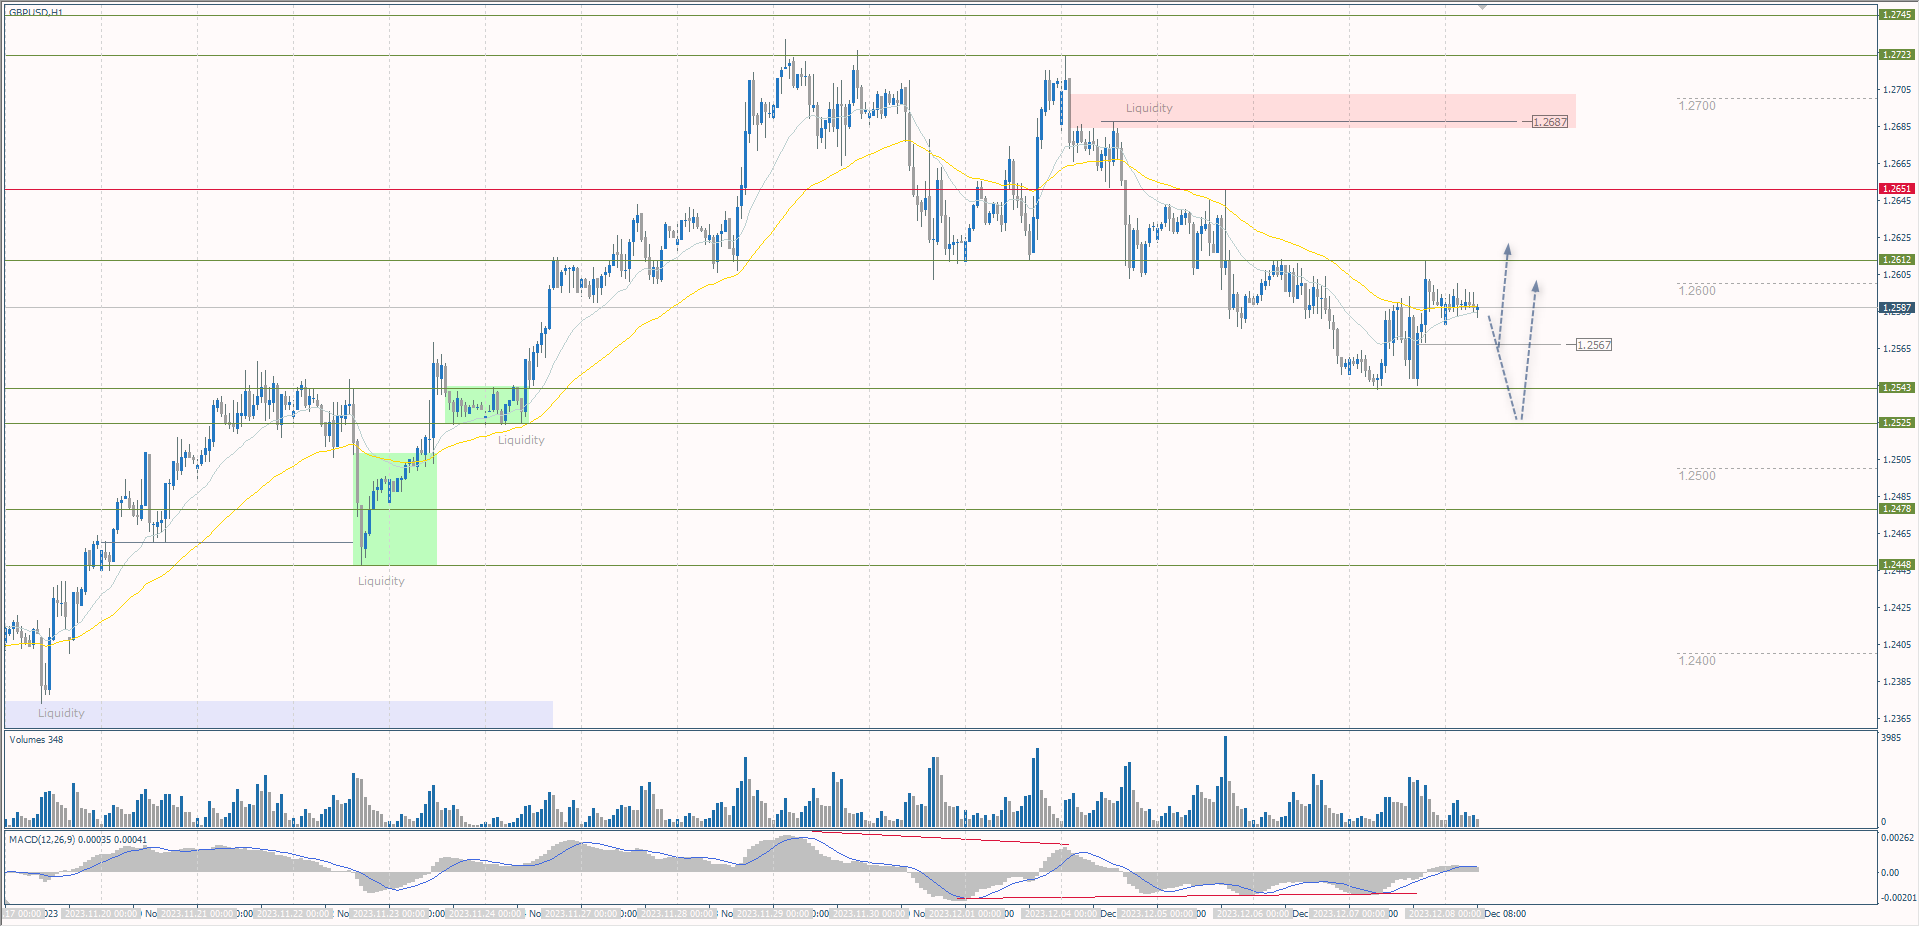 There is no news feed for today. The USD/JPY currency pairTechnical indicators of the currency pair:
On Thursday, the yen posted its biggest one-day gain in almost a year after Japanese monetary authorities unexpectedly made a direct hint of a monetary policy change. Bank of Japan (BoJ) Governor Kazuo Ueda said Thursday that the central bank has several options on what to set interest rates once it takes the cost of short-term borrowing out of negative territory. Markets took this as a potential sign that a policy change was imminent and pushed the yen higher. It should be understood that the Yen is currently strengthening due to expectations of a policy change, so once the rumors pass, it will lose some of its support.Trading recommendations
From the technical point of view, the medium-term trend on the currency pair USD/JPY is bearish. The market is very strongly reducing positions on the yen, which is embodied in the acceleration of the fall of the quotes. The MACD indicator has become deeply negative. Inside the day, sellers prevail, while there is no divergence, so the price can make new updates of the minimum. Sell trades can be looked for from the level of 144.40, provided the sellers’ initiative on the lower time frames. Buying should be sought after the breakout of the 144.40 resistance level with targets up to 146.23.Alternative scenario: if the price consolidates above the resistance level of 147.35, the uptrend will likely resume. 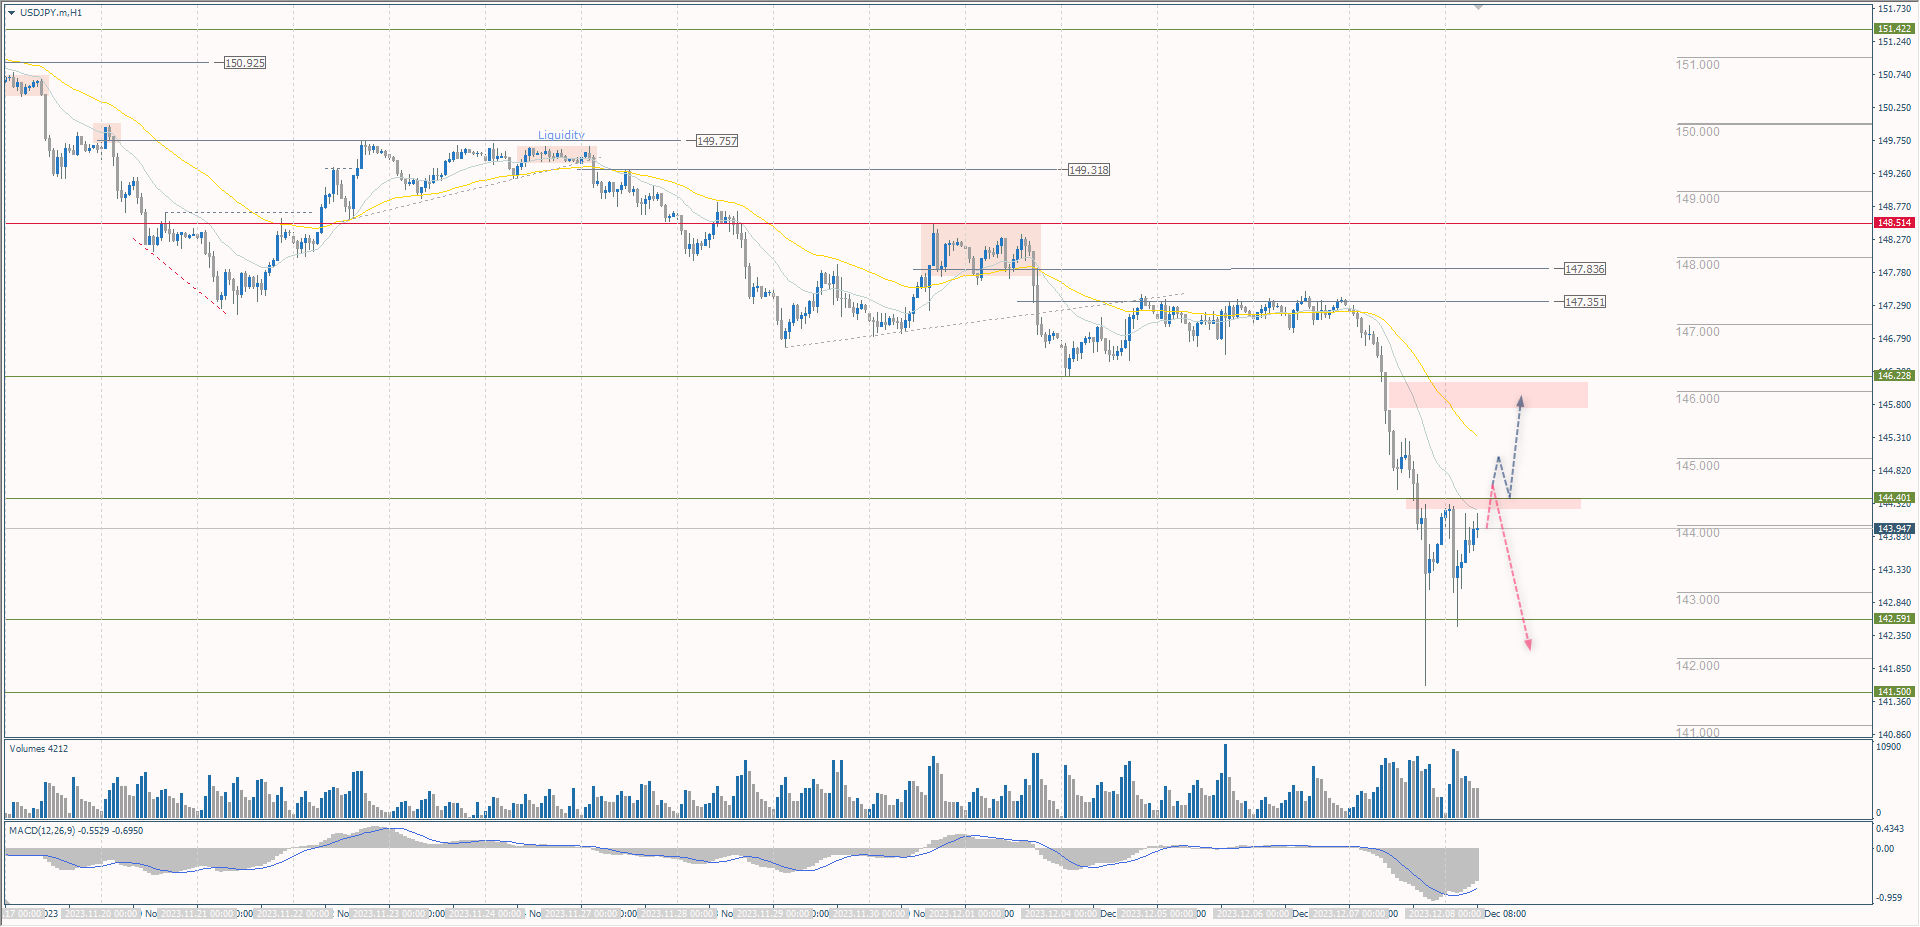 News feed for 2023.12.08:
The XAU/USD currency pair (gold)Technical indicators of the currency pair:Gold and silver prices closed lower on Thursday, with silver falling to a 2-week low. Comments from Bank of Japan Governor Ueda increased speculation that the BoJ will soon exit its negative interest rate policy, which was negative for gold as investors began rebalancing portfolios, selling some gold, and buying the yen in the medium to long term. Today, the Nonfarm Payrolls report will be released in the US, which will have a significant impact on gold pricing. A strong (better than expected) report may undermine bets that the Fed will start easing its restrictive monetary policy sooner than expected, which will serve as a headwind for gold.Trading recommendationsFrom the point of view of technical analysis, the trend on the XAU/USD is bullish, but it is close to change. Compared to yesterday, the situation has not changed much. Volatility on gold has decreased, while the price has formed a flat accumulation. Hence, we should expect an impulse on the news publication. As a rule, the movement, which was before the flat formation, will be the main one for continuation, so the probability of further decline is higher than the probability of growth. But it is necessary to be guided not by the price reaction and market conditions. Market conditions are not formed for buying at the moment because there is no bullish initiative. Traders can look for sell deals from resistance levels 2041 or 2079 but with confirmation only.Alternative scenario: if the price breaks below the support level of 2020, the downtrend will likely resume. 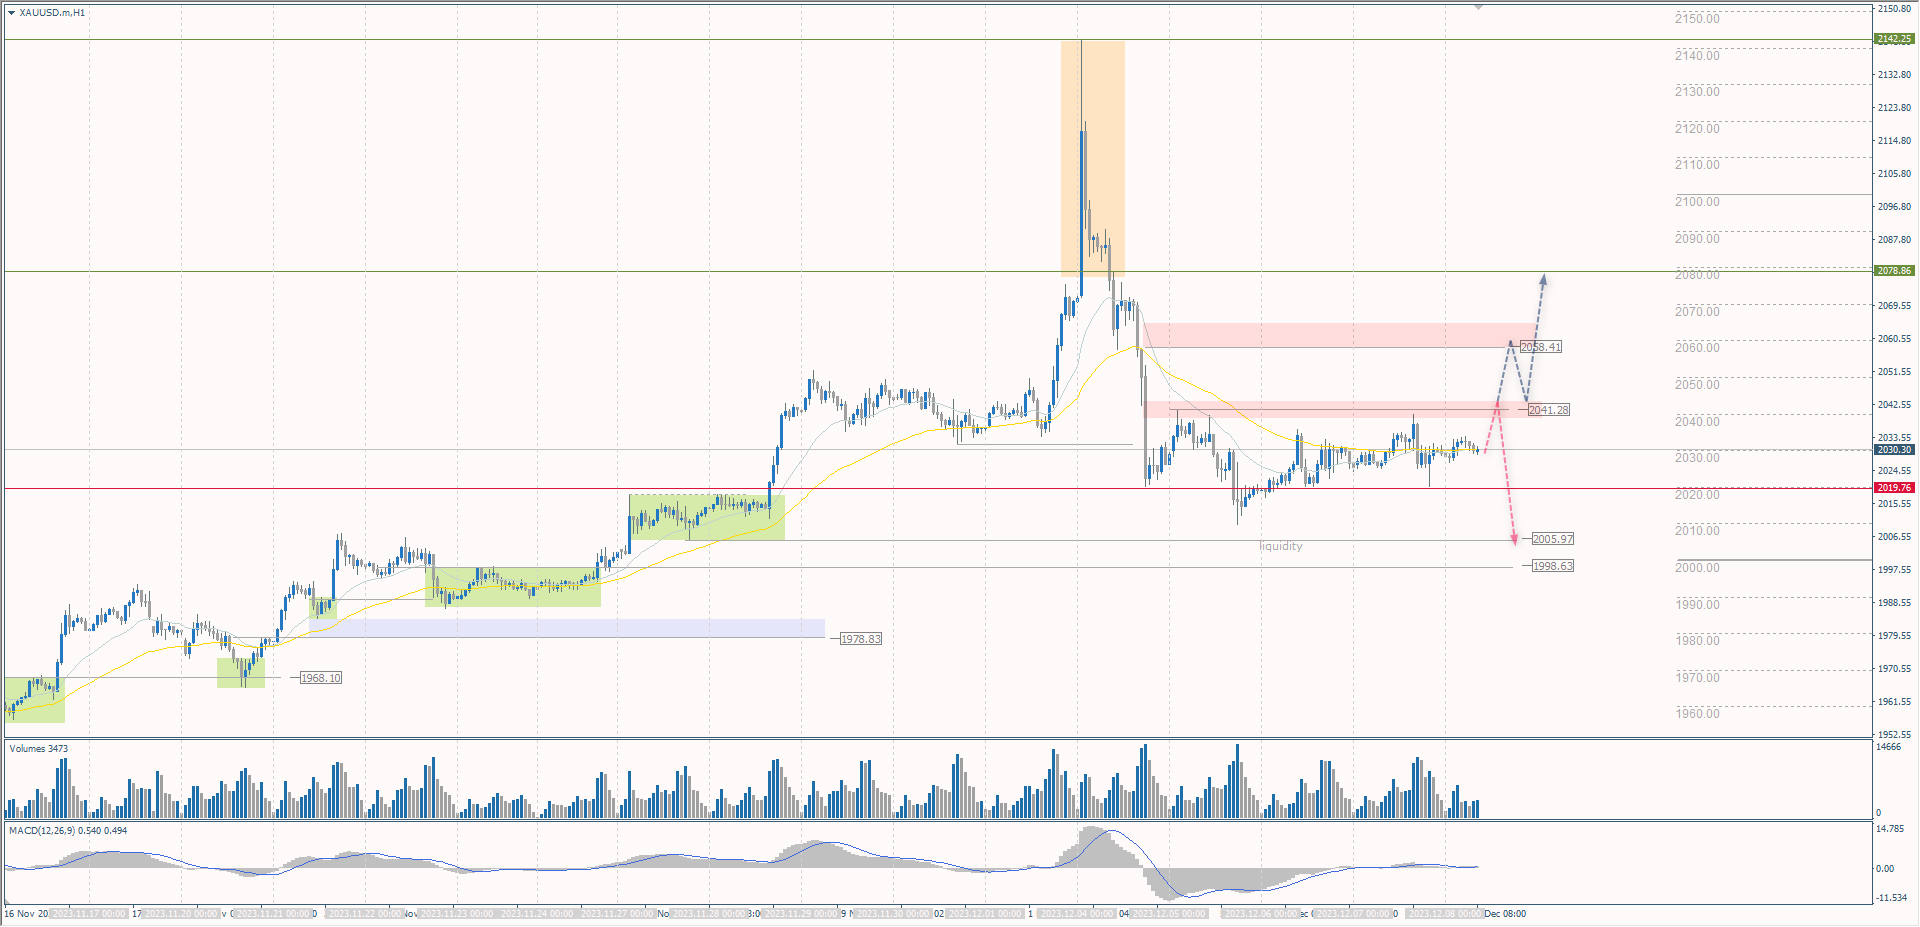 News feed for 2023.12.08:
More By This Author:Analytical Overview Of The Main Currency Pairs – Thursday, Dec. 7The Bank Of Canada Left The Interest Rate Unchanged Analytical Overview Of The Main Currency Pairs – Wednesday, Dec. 6


Leave A Comment