
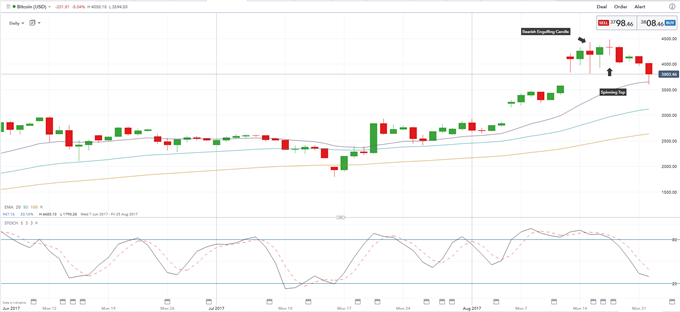
The latest volatile shift in Bitcoin saw the digital token hitting a fresh high before slumping nearly 20% as profit-taking took hold of the market. And a couple of bearish indicators stand out on the daily chart, leaving the token vulnerable to further moves lower. A look at the chart shows a bearish engulfing candle formation on Tuesday, August 15th, a pattern that is normally seen at the end of a bullish/upward trend. The high made on that Tuesday ($4430) was just a touch lower than Thursday’s, August 17th all-time high ($4480). And the spinning top chart pattern on Thursday gives another signal that the market is currently running out of upward momentum. A spinning top normally forms at the peak of an uptrend and suggests that buyers are losing interest, leaving the asset class vulnerable to a sell-off.
Chart: Bitcoin (BTC) Price: Daily Timeframe (June – August 22, 2017)
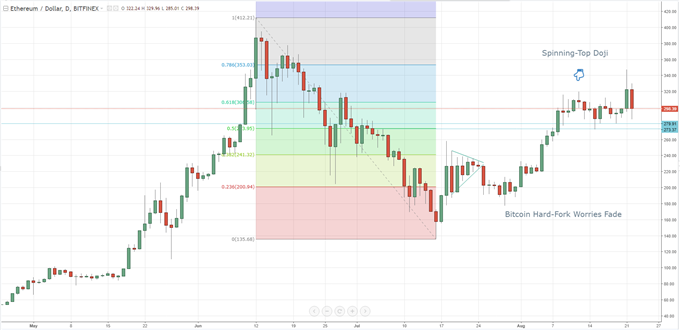
And the second largest digital currency by market cap, Ether (ETH), also soared and slumped in the last few days, but is still way below its all-time high. Monday’s jump to just $350 was fuelled by news that Ethereum will release a new update (hard fork) called Metropolis in late-September, similar to the Bitcoin hard fork at the start of the month. The Ethereum update will make programming easier and upgrade security to prevent hacking.
A look at the charts sees the 50% fibonacci retracement level around and the August 15 low both offering support around the $273 level, while the August 16 and 19 lows around $280 will also provide additional support.
Chart: Ether (ETH) Price: Daily Timeframe (May – August 22, 2017)
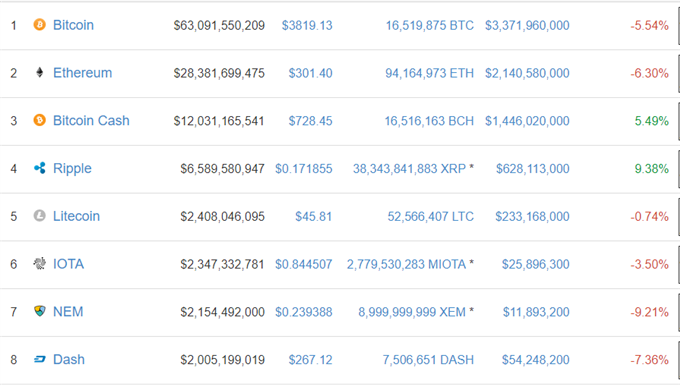
Market Moves/Top 8 Capitalizations – August 22, 2017


Leave A Comment