
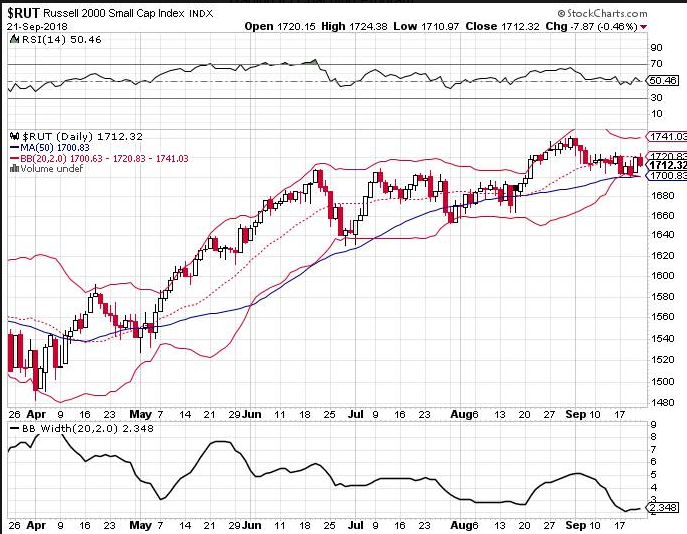
Bollinger Bands can be a great indicator to add in to your trading arsenal. Combining the Bollinger Band Width and an analysis of implied volatility can make a great foundation when looking to trade breakouts or consolidations.
Currently, on the Russell 2000 chart, we can see that the Bollinger Bands are as tight as they have been in 6 months. That’s not unexpected after a few weeks of very small movements on this index.
When combined with an analysis of implied volatility, we can get an idea of whether it is currently a good time to be long or short volatility.
The chart below shows implied volatility over the past 12 months. Again, we can see here that implied volatility (yellow line) is towards the lower end of the 12-month range.
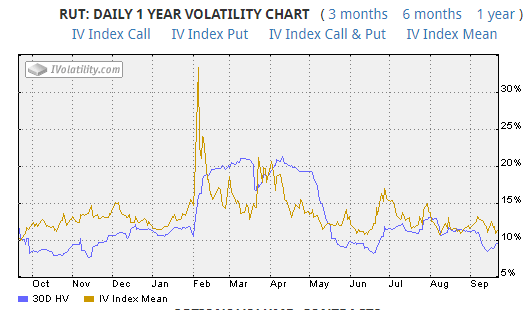
To me, this indicates that it’s not a great time to be short volatility on the Russell.
My primary strategy is iron condors, so for me, this analysis means being patient and waiting for a better set up, or at least trading very small contract size until conditions are more favorable.
If this low volatility and tight Bollinger Band condition continues for another week or two, I may even look at getting long volatility via a long straddle or strangle.
The video below explains a bit more about Bollinger Bands and how I use them in my trading:
Video Length: 00:06:12


Leave A Comment