
Market Analysis
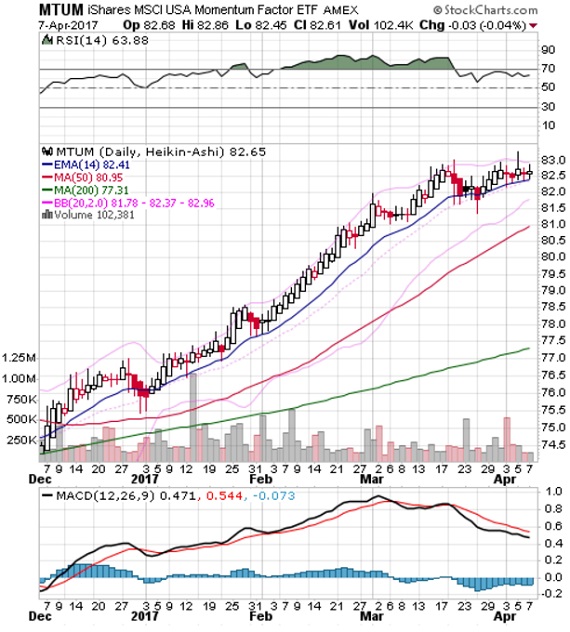
A standard chart that we use to help confirm the overall market trend is the Momentum Factor ETF (MTUM) chart. Momentum Factor ETF is an investment that seeks to track the investment results of an index composed of U.S. large- and mid-capitalization stocks exhibiting relatively higher price momentum.
This type of momentum fund is considered a reliable proxy for the overall stock market trend. We prefer to use the Heikin-Ashi format to display the Momentum Factor ETF.
Heikin-Ashi candlestick charts are designed to filter out volatility in an effort to better capture the true trend. Recently we have noted“… given the recent behavior of the stock market, now the question appears to be whether the price trend will continue to move sideways or start turning down…the trend continued moving sideways…will the price trend remain neutral or finally break through the top of the trading range…” Stocks prices have stalled a bit but aren’t really pulling back very much. Until technical indicators hint otherwise our recent analysis is still valid where we opined “…With earnings season starting up, the MTUM might be primed for a breakout which signals the next bull leg for the major indexes…” But, there is also the risk that if earnings fail to revive the market’s momentum, investors may be forced to play an extended waiting game for the next catalyst.
A tool to help confirm the overall market trend is the Bullish Percent Index (BPI). The Bullish Index is a popular market “breadth” indicator used to gauge the internal strength/weakness of the market. Like many of the technical market internal indicators, it is used both to confirm a move in the market and as a non-confirmation and therefore divergence indication. Nasdaq stocks have been leading the market direction for the past year.
Recently we opined “…the BPCOMPQ is beginning a recovery bounce…If the index follows up on its recovery bounce and continues higher, this might be a very strong signal that the other major indexes are set to break higher out of their recent trading ranges…” Basically, the Nasdaq is achieving new all-time highs on the back of a narrow group of stocks, primarily the FANG shares.


Leave A Comment