
The EUR/USD is still trading on the low ground following the Turkish crisis. Has it found a bottom?
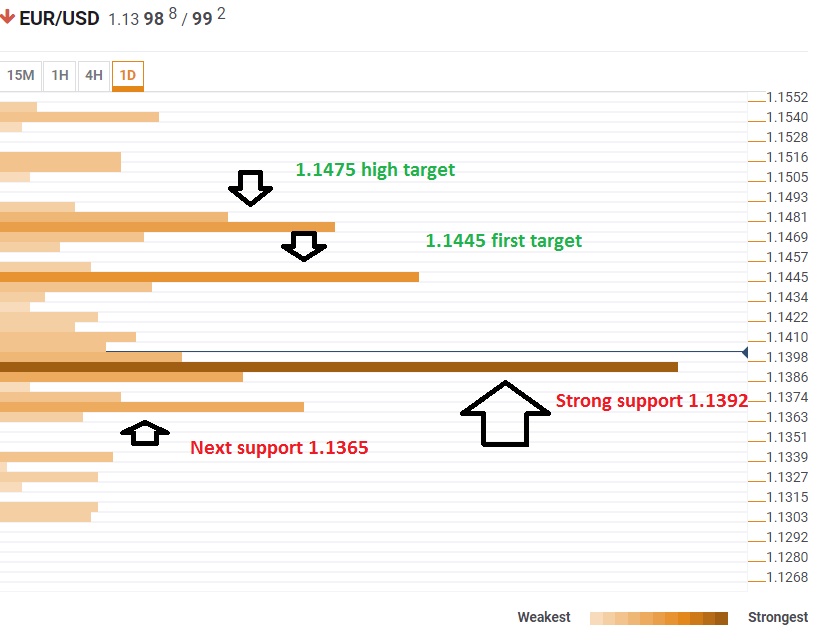
The Technical Confluences Indicator shows that the 1.1392 level is robust congestion of technical levels. This includes the 52-week low, last month’s low, last week’s low, the Fibonacci 61.8% one-day, the Simple Moving Average 10-4h, and the Bolinger Band one-hour low.
Further down, 1.1365 is the confluence of the Pivot Point one-month Support 3, the one-day low, and the Pivot Point one-day Support 1, but this is weaker support.
Looking up, 1.1445 could be the first target on recovery with the convergence of the Fibonacci 161.8% one-month, the Bolinger Band one-day Lower, and the Fibonacci 23.6% one-week.
The next target is 1.1475 which is the meeting point of the Pivot Point one-month Support 2, the PP one-day Resistance 2, and the Fibonacci 38.2% one-week.
Here is how it looks on the tool:
Confluence Detector
The Confluence Detector finds exciting opportunities using Technical Confluences. The TC is a tool to locate and point out those price levels where there is a congestion of indicators, moving averages, Fibonacci levels, Pivot Points, etc. Knowing where these congestion points are located is very useful for the trader, and can be used as a basis for different strategies.
This tool assigns a certain amount of “weight” to each indicator, and this “weight” can influence adjacents price levels. These weightings mean that one price level without any indicator or moving average but under the influence of two “strongly weighted” levels accumulate more resistance than their neighbors. In these cases, the tool signals resistance in apparently empty areas.


Leave A Comment