Following futures positions of non-commercials are as of September 4, 2018.
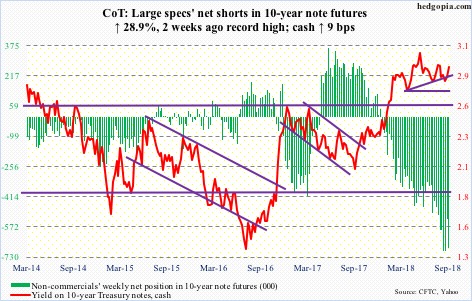
10-year note: Currently net short 682.8k, up 152.9k.
Bulls and bears went back and forth this week around the 50-day moving average until Friday when the 10-year rate (2.94 percent) rallied six basis points on the back of August’s jobs report. That said, risks of a potentially bearish head-and-shoulders formation continue to linger on, with the neckline around 2.75-2.8 percent, which was tested and defended last month. In the midst of all this, daily Bollinger bands are narrowing. At some point, they begin to widen, releasing suppressed energy. Rates in this event can go either way – up or down. Non-commercials, who are neck-deep in net shorts in 10-year note futures, better hope it is not to the downside. Risks of a short squeeze are real.
30-year bond: Currently net short 40.4k, up 34.7k.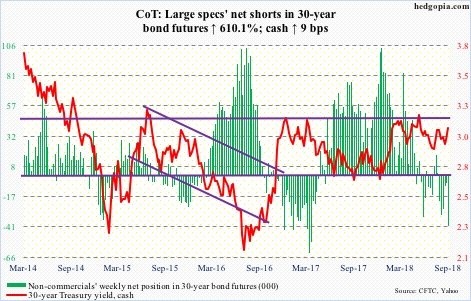
Major economic releases next week are as follows.
The NFIB small business optimism index (August) and JOLTS (July) will be reported Tuesday.
Small-business job openings rose a point month-over-month in July to 37, a new record.
Non-farm job openings in June increased 3,000 m/m to 6.66 million. A record high 6.84 million was recorded in April.
August’s PPI is scheduled for Wednesday. Producer prices were unchanged in July m/m and advanced 3.3 percent in the 12 months to July. Over the same time period, core PPI rose 0.3 percent and 2.8 percent, respectively.
Thursday has August’s CPI on tap. In July, both headline consumer prices and core CPI rose 0.2 percent m/m. In the 12 months through July, they increased 2.9 percent and 2.4 percent, in that order.
Retail sales (August), industrial production (August), and University of Michigan’s consumer price index (September) are on the docket Friday.
Retail sales in July grew 6.4 percent year-over-year to a seasonally adjusted annual rate of $507.5 billion. This was the fastest growth rate since February 2012.
Capacity utilization inched down 0.1 percent m/m in July to 78.1 percent. April’s 78.3 percent was the highest since February 2015.
Consumer sentiment declined 1.7 points m/m in August to 96.2. Sentiment has shifted lower since peaking at 101.4 in March, which was the highest since January 2004.


Leave A Comment