Inflation could be the most important metric to follow because if it gets too high, the Fed will need to accelerate rate hikes which could cause a yield curve inversion and later a recession. One very important thing to keep in mind before we analyze the inflation numbers is the year over year comparisons are weak because inflation was low in 2017. This means inflation accelerating isn’t as impressive as it would be if the comparisons were tougher. Because the business cycle is 9 years old, there is bias to expect sustained core inflation above 2%, but that doesn’t mean it will occur.
Many labor market stats signal there is still enough slack in the labor market to limit wage growth. Oil prices are down 6 straight weeks which is the longest streak in 3 years. Commodity prices are down overall as the Bloomberg Commodities ETF is down 1.65% year to date. That’s not a recipe for inflation to get out of control.
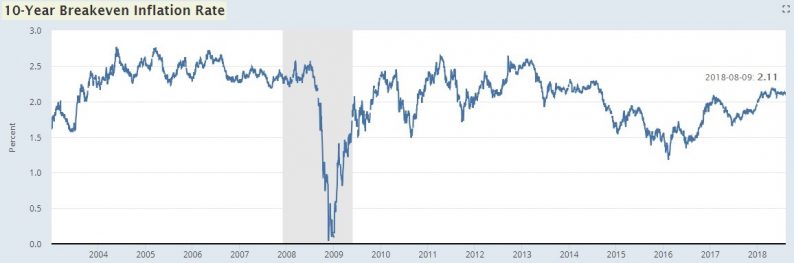
As you can see from the FRED chart below, the 10-year breakeven inflation rate is only 2.11%; this recent range is the highest since September 201, but is hardly impressive when compared to the rest of the cycle.
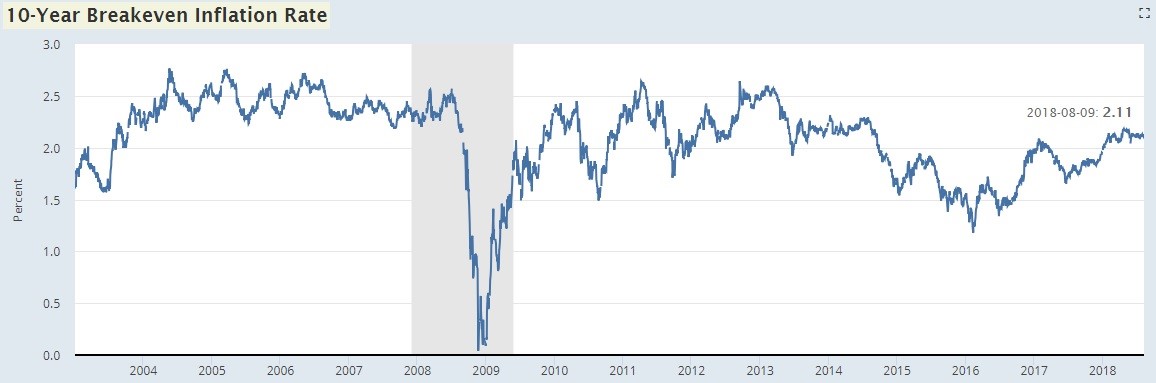
Source: FRED chart below
This explains why the 10 year treasury yield can’t stay above 3% for more than a few days. The economy hasn’t made the transition from policy makers and economists wanting more inflation to investors fearing it. One aspect which could get investors and the Fed fearing inflation is a trade war. The tariffs are causing higher prices, but the impact is still very small.
PPI Inflation Disappoints
The PPI inflation measures the prices producers are dealing with which means it is up the supply chain. The CPI measures the end markets as it shows the price pressures consumers face. In theory, this means the PPI is a leading indicator for the CPI, but it doesn’t always work out. Sometimes producers raise prices more than their input costs suggest and sometimes they take margin hits by not passing price increases down to the consumer.


Leave A Comment