On Tuesday, crude oil wavered between small gains and losses, but finally closed another day under the upper border of the short-term rising trend channel. Will this show of oil bulls’ weakness trigger further deterioration in the coming days? Will the relationship between black gold and oil stocks give us more clues about future moves?
Crude Oil’s Technical Picture
Before we answer this question, let’s examine the technical picture of crude oil (charts courtesy of http://stockcharts.com).
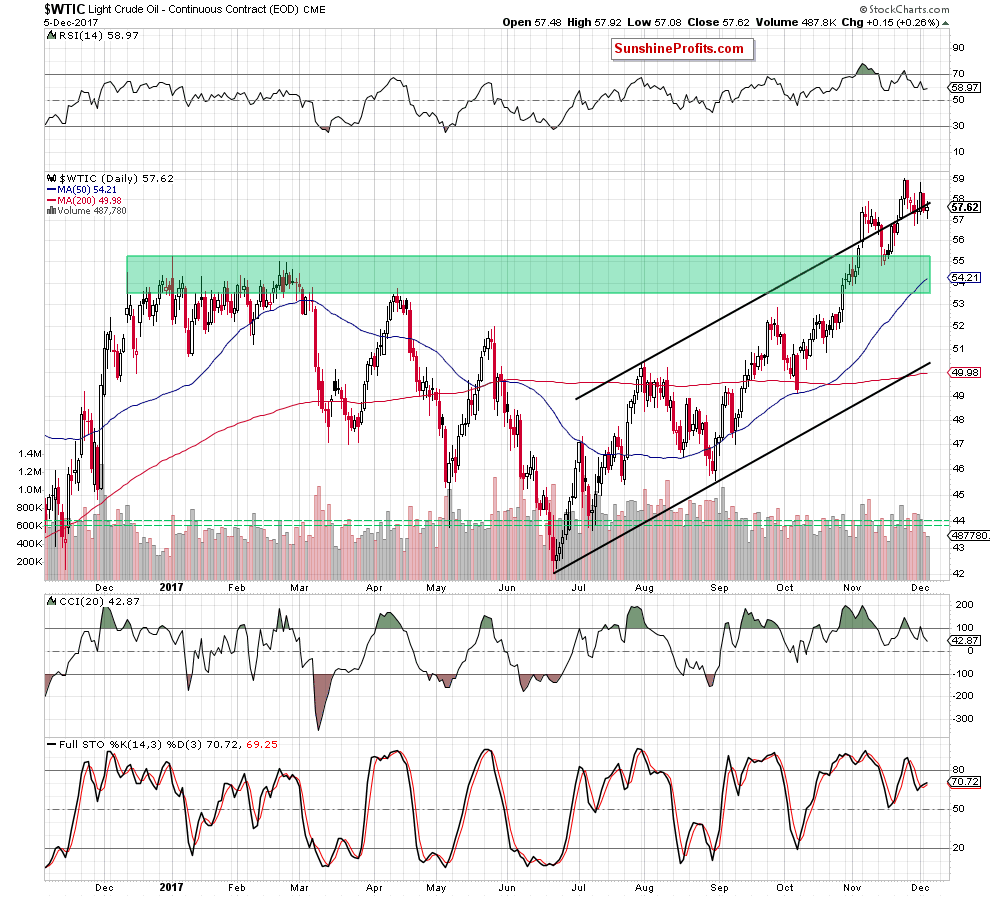
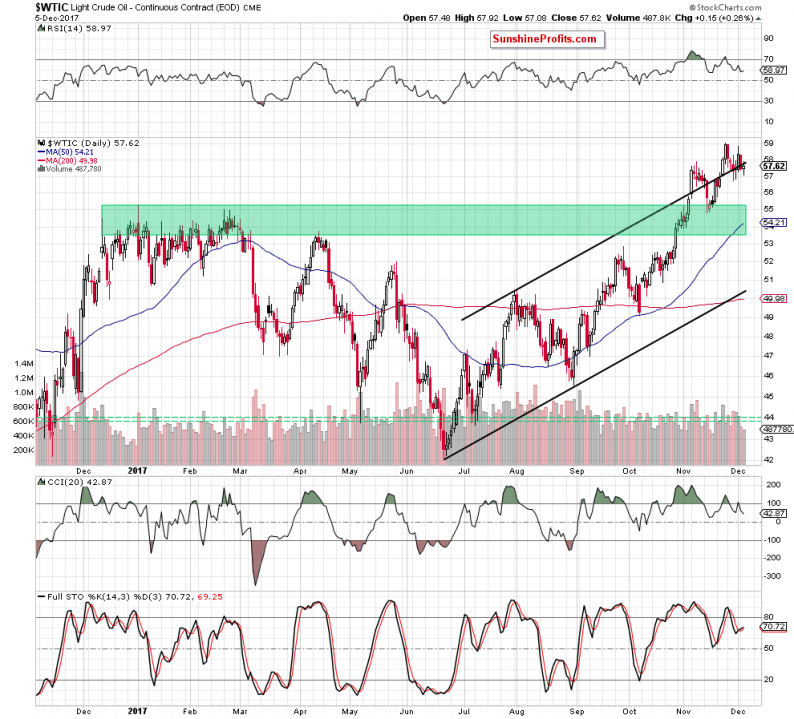
Looking at the daily chart, we see that although oil bulls managed to stop declines after the market open and triggered a rebound, black gold closed yesterday’s session under the upper border of the short-term rising trend channel. Such price action looks like a verification of the Monday breakdown, which doesn’t bode well for oil bulls and higher prices of black gold in the coming days.
Additionally, the size of volume, which accompanied yesterday “increase” was smaller than day earlier, which together with the sell signals generated by the RSI and the CCI suggests that the comeback of oil bears is just a mater of time (most likely a short period of time).
The pro bearish scenario is not only reinforced by the broader picture of crude oil and negative divergences between the WTIC:UDN and the price of crude oil priced in the U.S. dollars (we wrote more about these issues in our Monday Oil Trading Alert), but also by the current situation in the oil-to-oil stocks ratio.
Relationship between Crude Oil and Oil Stocks
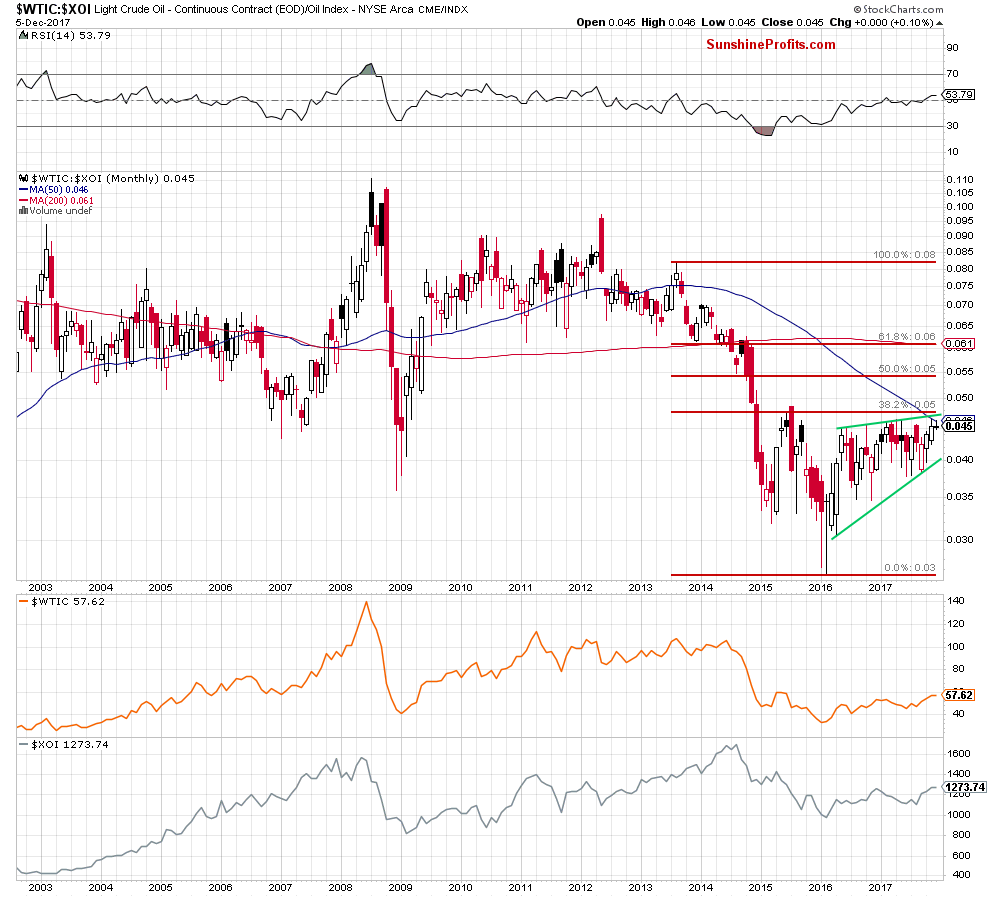
Looking at the monthly chart, we see that although the ratio increased in the previous month, the 50-month moving average together with the proximity to the upper border of the green rising wedge and the 38.2% Fibonacci retracement stopped the bulls, triggering a pullback. Earlier this month, we saw another unsuccessful attempt to move higher, which suggests that a bigger move to the downside may be just around the corner.


Leave A Comment