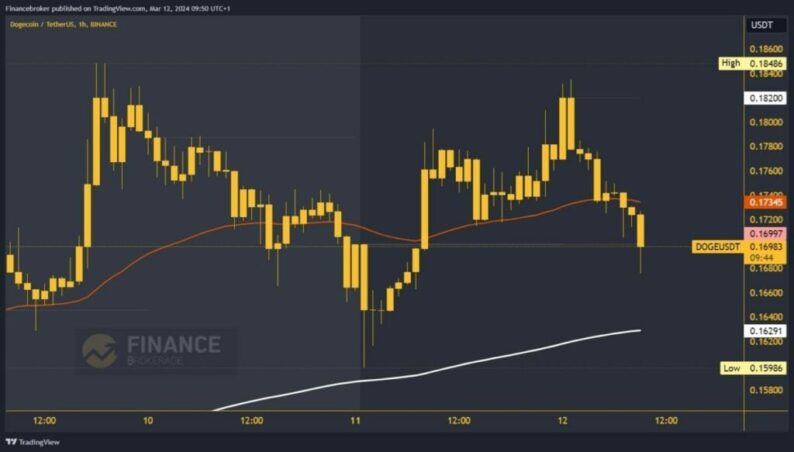
Dogecoin chart analysisOver the weekend, the price of Dogecoin managed to climb up to 0.18486 levels. There we encounter resistance and pull back from that level until Monday morning at the 0.15986 level. The price finds support there and starts a bullish consolidation. Additional support on that low is the EMA200 moving average. By the end of the day, Dogecoin climbs to the 0.18350 level and forms a weekly high there.This morning, we saw a new bearish consolidation and a pullback from that level. At the 0.16750 level, we are making a daily low, and we are under pressure from the EMA50 moving average, which could prolong this withdrawal. Potential lower targets are the 0.16600 and 0.16400 levels. The EMA200 moving average provides additional support at the 0.16400 level.  Shiba Inu chart analysisOver the weekend, Shiba Inu’s price continued to move away from the previous high at 0.00004575. Yesterday morning, the price fell to the 0.00003002 level, after which we got support at that level. Shiba gets additional support in EMA200, which does not allow us to fall below. That pushes the price to a new weekly high at the 0.00003522 level. Today we had a new attempt to reach that level but stopped at the 0.00003487 level. We are pulling back towards EMA200, hoping to find new support and start a recovery. If the Shiba Inu price falls below EMA200, it would be under stronger bearish pressure to move into a further pullback. Potential lower targets are the 0.00003000 and 0.00002900 levels.
 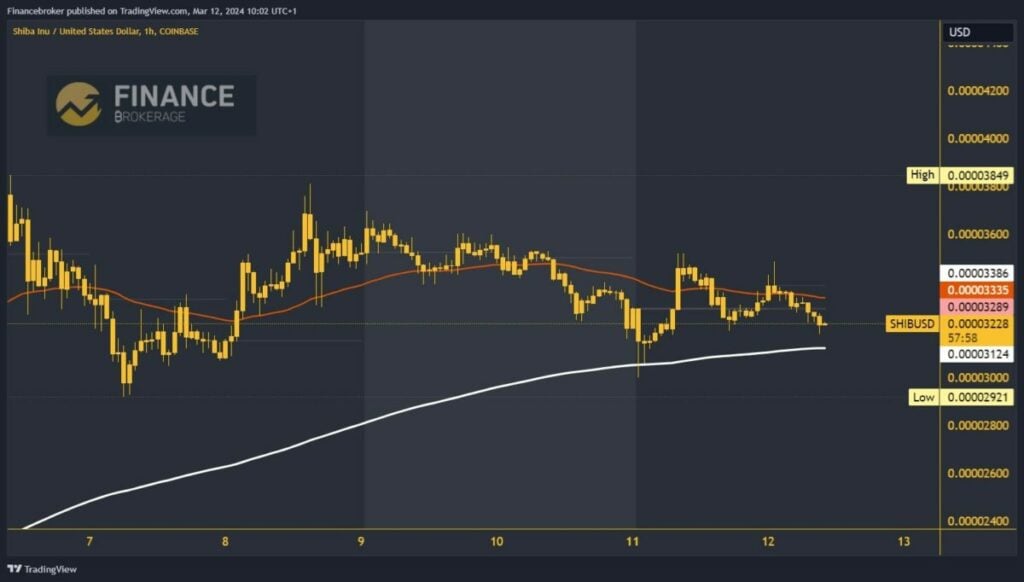 More By This Author:Cardano Soars Past $0.780, Eyes $0.8320EU’s Policy Crisis: Falling Behind US In Productivity Bitcoin Price Breaks Through $70000 And Rises To $71837


Leave A Comment