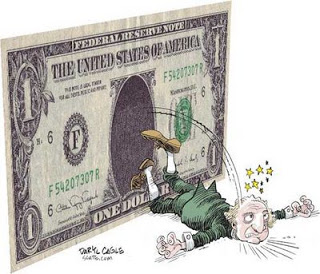
The US dollar fell against most of the major and emerging market currencies for the second consecutive week. The combination of market positioning, weak confidence that the Fed will hike rates this year, and the rise in some industrial commodities seemed to be the main drivers. Technical considerations warn of scope for additional dollar losses in the coming sessions.

Among the major currencies, the Australian and New Zealand dollars did best. Both appreciated by about 4% against the greenback. The RBA signaled no strong urgency to cut rates again, and New Zealand drew succor from a recovery in milk prices.
The yen was the weakest of the majors. It lost about 0.3% and was the only major currency to lose ground against the dollar. The equity rally and the modest 3-4 bp rise in US yields took weighed on the yen and given the strength of the relatively high-yielding Aussie and Kiwi, there was much talk about renewed use of the yen as a funding currency (carry trades).
The Dollar Index fell through the trend line drawn off the spike lows on August 24 and September 18. It held on October 8 but convincingly broke before the weekend. The trendline is near 95.10 and rises toward 95.50 by the end of next week. A break of 94.60 targets 94.00-94.20. A push through 94.00 would be an ominous development, signaling a test on 92.60 low from late-August, but possibly even toward 91.30, the measuring objective of the possible double top carved out in August and September.
In a similar fashion, the euro has moved above the down trendline connecting the August 24 and September 18 highs. It came in near $1.1280 before the weekend and fell toward $1.1200 by the end of next week. The immediate target is $1.1400 and then $1.1475. The RSI and MACDs suggest that further euro gains are likely. From a longer-term perspective, note that after falling from around $1.40 in May 2014 to $1.04 in March 2015, the euro has been trading broadly sideways in the trough, unable to retrace even 38.2% of its decline (which would bring it to $1.18). We note that the 50, 100, and 200-day moving averages are converging in the $1.1150-$1.1200 range.


Leave A Comment