Market Outlook
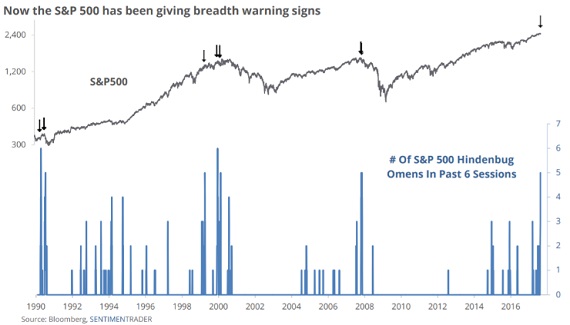
A recent report in MarketWatch suggests the dreaded so-called Hindenburg Omen is back. Named for the German airship that met its demise in a fiery explosion 80 years ago, the appearance of this technical pattern sometimes portends a stock-market crash. Even as the S&P and the Dow Jones Industrial Average rose to new highs, there were more stocks hitting 52-week lows than 52-week, something the market hasn’t seen since July 2015, according to Jason Goepfert, president of Sundial Capital Research, And this divergence has triggered a Hindenburg Omen on the S&P 500 for five out of the last six sessions. “It is a serious signal that highlights times of decoupling within an index or exchange. The S&P hasn’t suffered five signals so tightly clustered since 2007, and 2000 prior to that,” he wrote in a report. Such clusters typically lead to poor returns in subsequent days and the last time a similar trend emerged, in November 2007, stocks fell by 1.6% in the following week and 2.3% two weeks later. A year later, the S&P 500 was about 40% lower. This year, the pattern has been popping up more often in all four main indexes, including the Russell 2000 RUT, -0.08% Goepfert has counted 74 omens so far in 2017, second only to 78 recorded in November 2007. These warnings aren’t necessarily a signal to bail out of the market immediately as they sometimes turn out to be false alarms as was the case in May 2015. Still, that they are manifesting in several indexes and forming so frequently are good reasons to brace for weakness, according to Goepfert.


Leave A Comment