Daily Forex Market Preview, 2/10/2016
The US Dollar remained weak yesterday despite the lack of any market events. EUR/USD was seen trading near 1.13 while Gold attempted another go at the $1200 handle but failed. The economic calendar is busy today with the UK manufacturing and industrial production numbers due during the European session while Janet Yellen’s semi-annual testimony is due later in the evening.
EUR/USD Daily Analysis
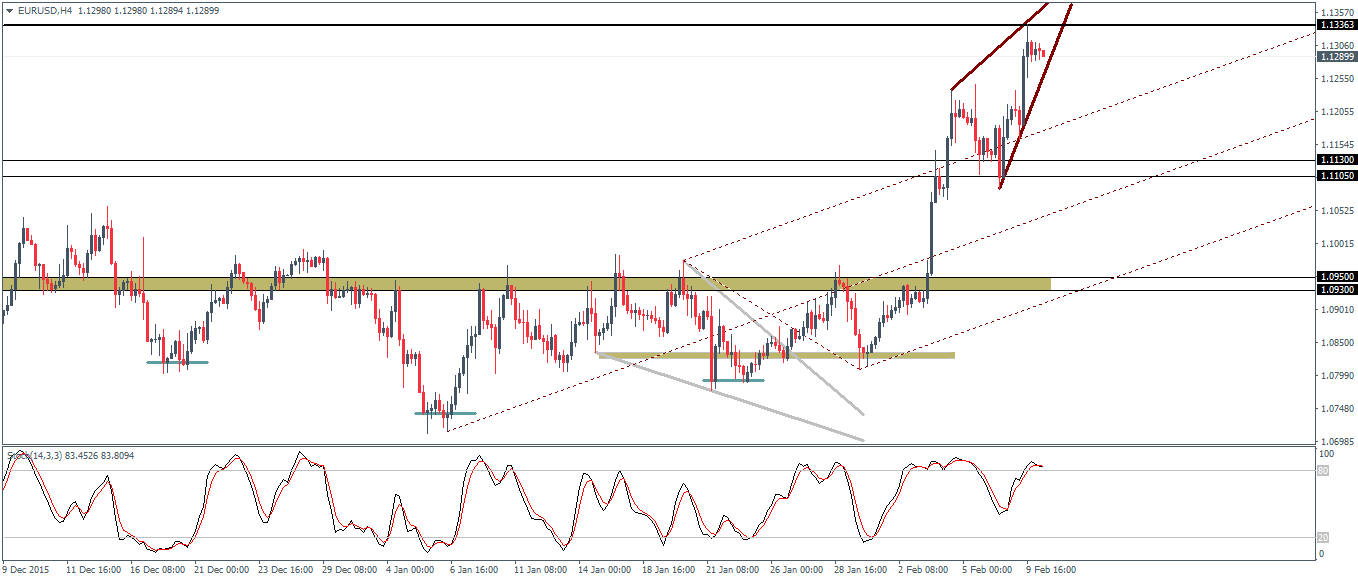
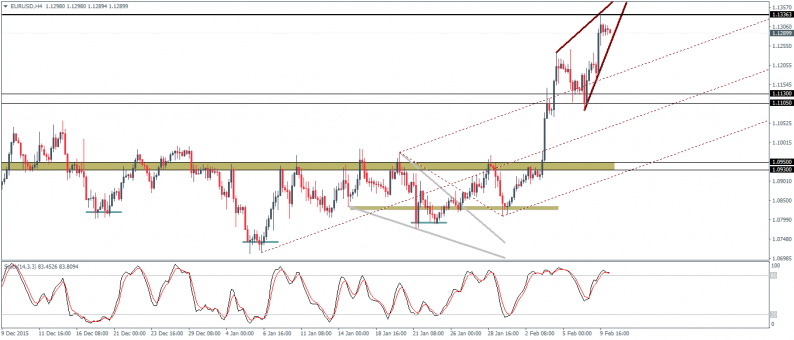
EUR/USD (1.12): EUR/USD was seen briefly trading near 1.130 yesterday after prices rallied strongly during the NY trading session. Despite the rally, the resistance zone near 1.13 – 1.12 should be able to contain the rally for the moment, with a pullback likely to see a decline back to 1.11 – 1.113 where an initial support looks to have formed. There is also a strong bearish divergence that is still in play with prices expected to decline back to 1.095 – 1.0 9 level where support needs to be established in order to make further rallies more meaningful. The 4-hour chart shows a rising wedge being formed at the top of the rally and a breakout from this rising wedge could signal a move to the downside. However, if prices break above 1.1336, further upside in EUR/USD cannot be ruled out.
USD/JPY Daily Analysis
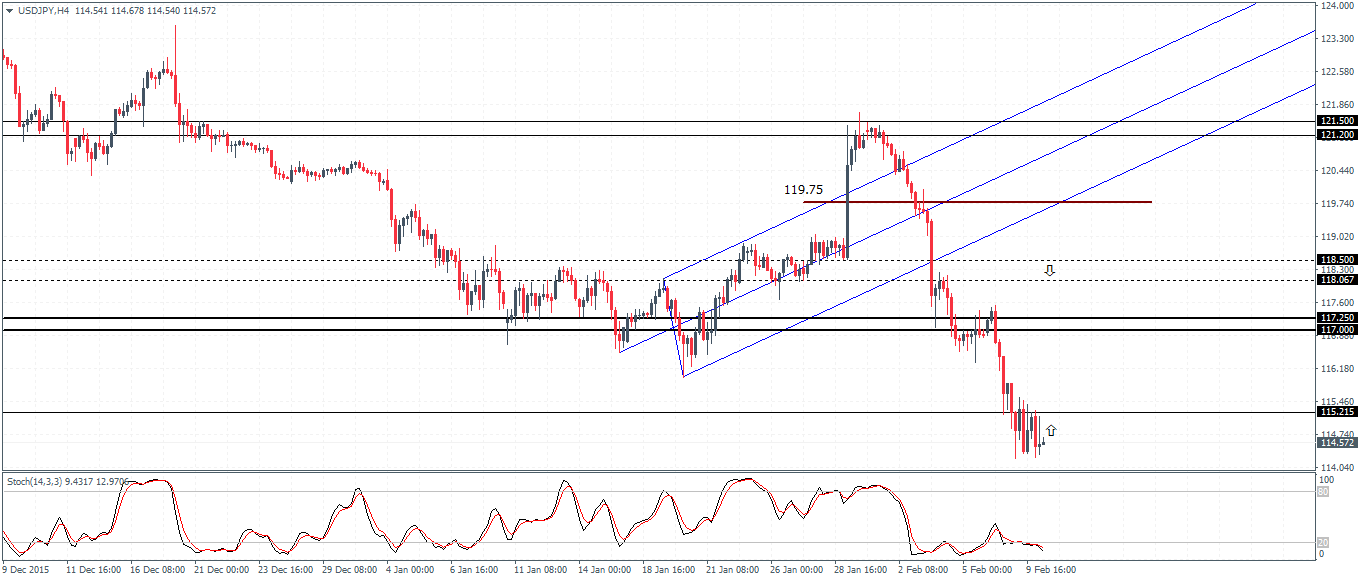
USD/JPY (114.6): USD/JPY is now trading at 114.6 after breaking below the 115 barrier. Resistance is seen at 117.065 – 116.2 region and a pullback here is expected ahead of further declines. Only a close above 117 will mark a move towards 118.4 level of next resistance. On the 4-hour chart, USD/JPY is showing strong consolidation within the 115.2 – 114.3 levels, which could indicate a potential breakout in the near term with a pullback likely to initially stall near 117.25 – 117.0 while the 4-hour Stochastics divergence points to 119.75 as the level prices could correct too.
GBP/USD Daily Analysis
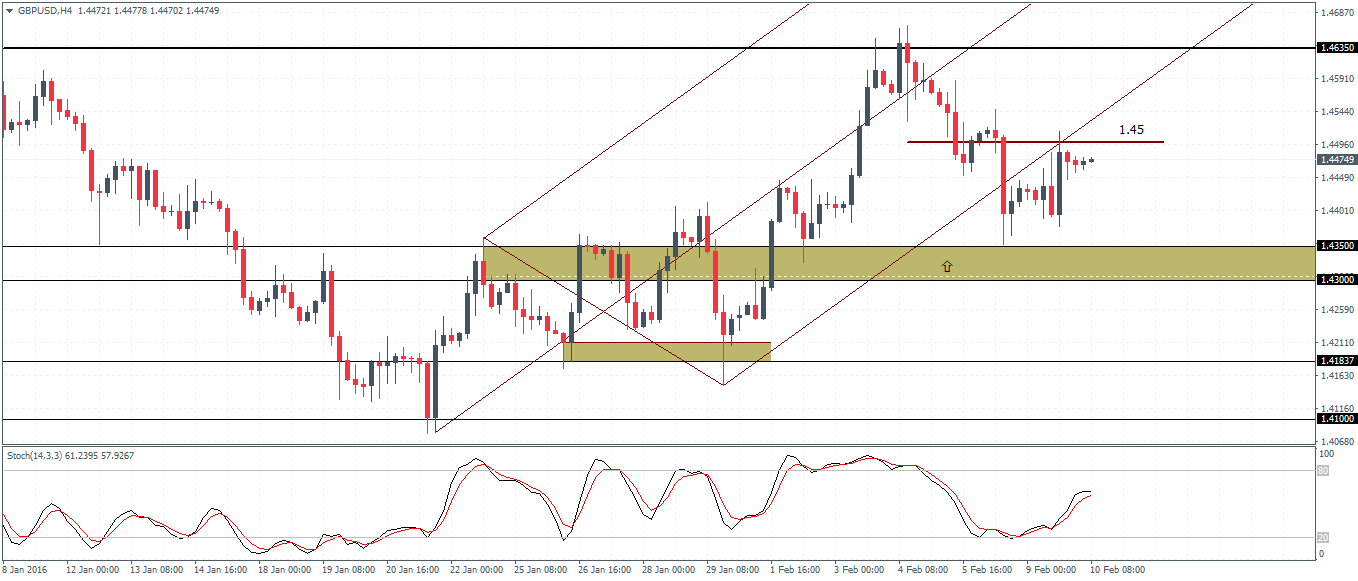
GBP/USD (1.44): Prices bounced off the 1.443 support yesterday and price action is likely to range from 1.443 – 1.463 levels for the near term. To the downside, the support at 1.435 – 1.40 was barely tested and exposes a potential risk for a move to the downside. 1.45 is the main resistance level on the short term chart and as long as GBP/USD is capped below this resistance, a decline to 1.43 cannot be ruled out. Above 1.45, GBP/USD could rally to retest the previous highs near 1.4635.


Leave A Comment