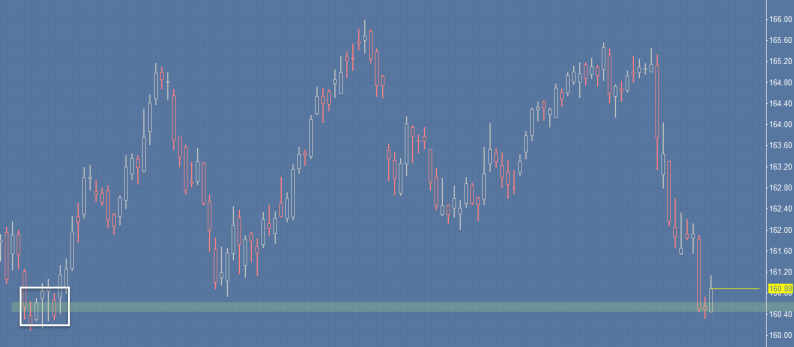
Looking at the plain daily chart, we can observe the end of the one-time-framing lower behavior which occurred for several weeks as Friday’s high got taken out. A previous balance area seems to be supportive for now.

Looking at the weekly volume profiles, we can identify a double distribution profile. The market opened inside of the lower acceptance area and traded inside of it. Let’s see how the market could possibly test the upper distribution.
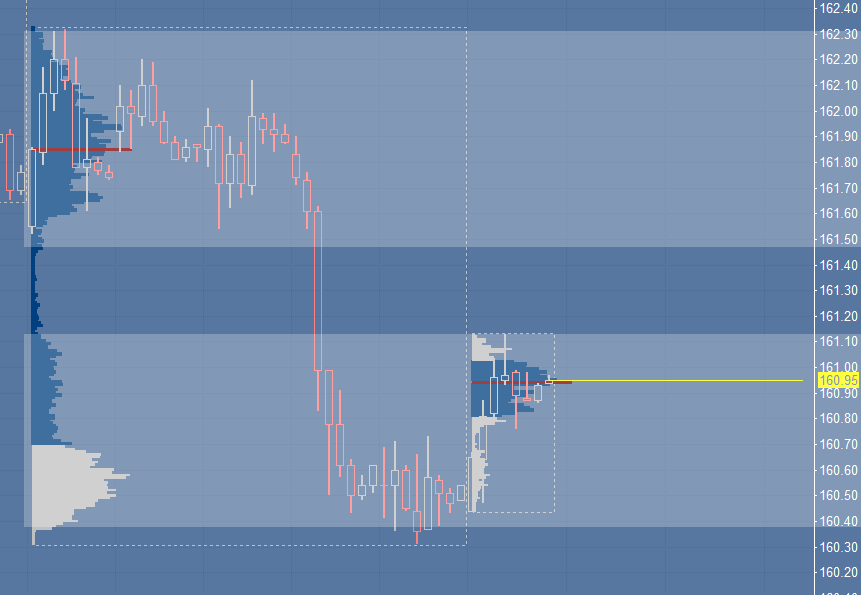
Let’s move forward to the daily volume profiles. We opened inside of Friday’s balanced range and value. In the end, the market broke out to the north and left us with a ‘P’ shaped profile, distribution and value in the upper area of yesterday’s range. In this situation, the VPOC should be closely monitored. Open above, bullish; Open below, bearish. However, a break of the VPOC could happen as well. We simply adjust the game plan accordingly. Friday’s value area is suspicious for a potential test, inclusive with long opportunity in my opinion. I will keep the eyes on these areas for sure.

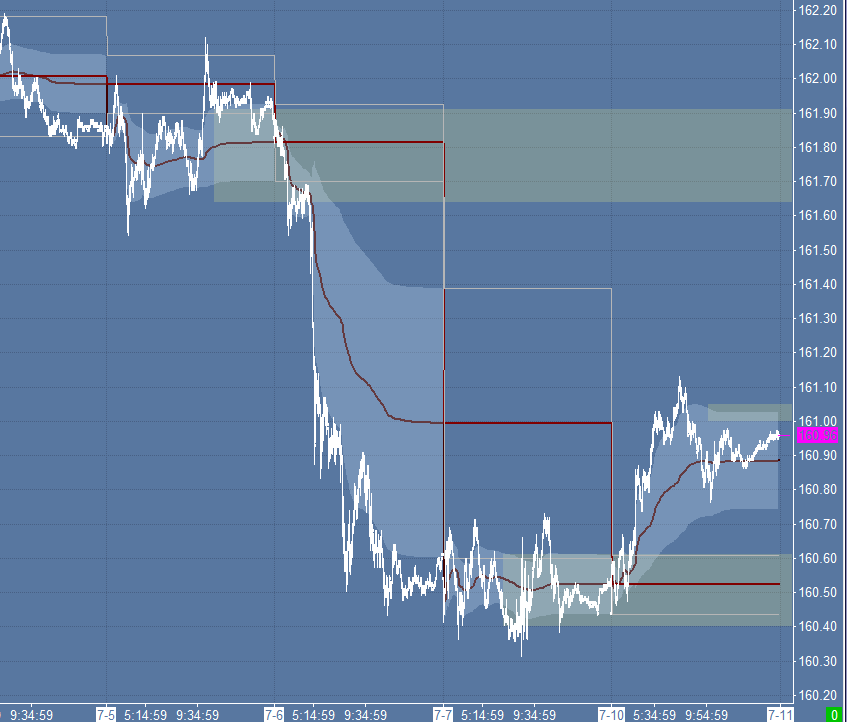
Last but not least the VWAP chart overlaid with the mentioned areas. Any levels of confluence? Depending on the open I will observe the positive 1st standard deviation level (VAH close). The VAL does not feel as a stable support in my opinion.


Leave A Comment