
The BLS reported on Friday that the U.S. unemployment rate was down to 5% in October and November, its lowest level since 2008.
The dramatic surge in unemployment during the Great Recession and its stubborn persistence in coming back down were both dominated by a tremendous increase in the number of people who spent longer than six months looking for a job. If we only counted individuals searching for six months or less, the unemployment rate today would be 3.7%, near the lowest levels for that measure over the last half century.
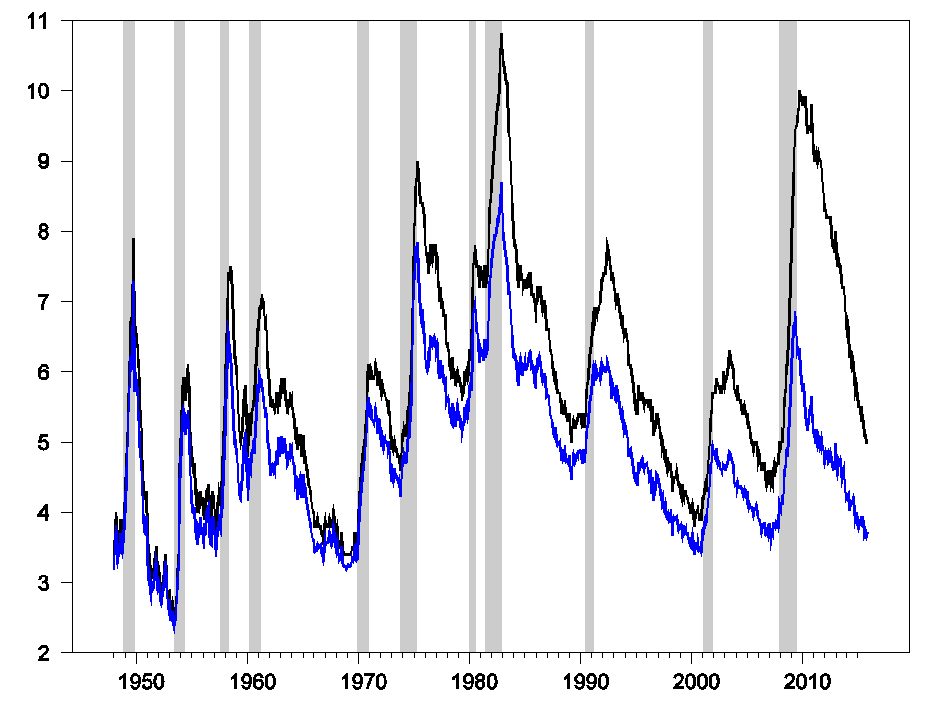
Figure 1. Seasonally adjusted number of people unemployed as a percent of the labor force (or the usual unemployment rate, in black) and number of people who were unemployed for 6 months or less as a percent of the labor force (blue). Latter calculated by multiplying unemployment rate by one minus the fraction unemployed for 27 weeks or longer.
One of the best predictors of whether an individual who is unemployed today will still be unemployed next month is how long that individual has already been looking for a job. For most of the last 50 years, if you considered an individual who has only been looking for work for one month, more likely than not you would find that individual was no longer unemployed the following month. But in every year of the sample, if you looked at an individual who had already been looking for work for longer than six months, there would be a better than an 80% chance that individual would still be unemployed the following month.
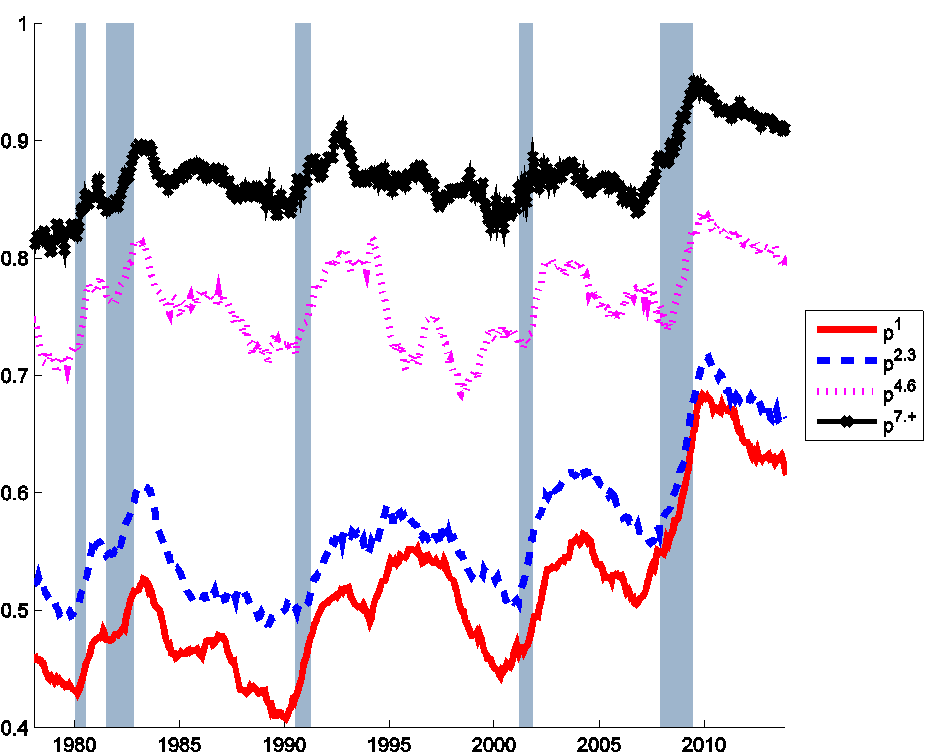
Figure 2. Probability that an unemployed individual will still be unemployed the following month for different durations of job search, Jan 1976 to Dec 2013. Red: individuals who have been unemployed for less than 1 month as of the indicated month; blue: unemployed for 2-3 months; fuchsia: 4-6 months; black: longer than 6 months. Calculated as described in foonote 1 in Ahn and Hamilton (2015).
One possibility is that the process of being unemployed for longer than a month actually changes an individual through some kind of scarring effect. For example, employers may start to discriminate against those who have been out of work for longer. Another possibility is that there are important differences across individuals that began in their very first month without a job, with some people having less favorable skills and opportunities. If you follow those individuals over time, the ones who are still looking after six months will be selectively drawn from those who had a much lower probability of finding a job from the very beginning.
You can see how this could happen with a simple example. Suppose that in a given group of 100 newly unemployed individuals, 20 of them are “type L”, who have an 85% chance of still being unemployed next month, while the other 80 are “type H”, who only have a 35% chance of remaining unemployed. After one month of searching, 17 of the type L (85% of the original 20) will still be looking for work, compared with 28 of type H (35% of the original 80). Of the people who are still searching after 2 months, 60% (15/25) will be type L, even though they were only 20% of the original 100. After 6 months, 9 of the original 100 may still be looking for work, and they are almost certain all to be type L.


Leave A Comment