The big project my team and I’ve been working on this year is the development of the web version for the OSV stock analyzer.
Additionally, a vital piece that I always felt was missing with the current stock analyzer was the lack of a fundamental, value based, grading and ranking system.
Not anymore.
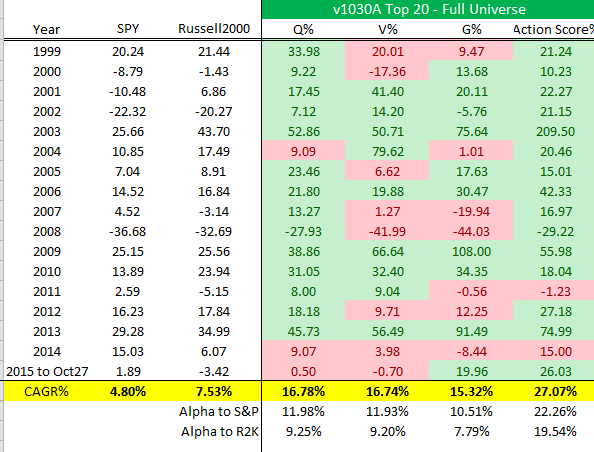
For close to 3 months, I’ve been working with a mathematician to work out a simple and effective method to rank, rate and then backtest the performance of the stock universe based on;
The QVG method is nothing new. It’s already used widely throughout the investment community.
But the results obviously differ based on how quality, value and growth are defined.
And so far, my backtest is producing a 27.1% compounded average returns when the best of all three are combined. I call this the “Action Score” to reflect the idea that the stocks scoring the highest for all three should be the ones you should be focusing and spend time “acting” on.
Whether that be reading, learning, tracking or buying, the high Action stocks are the ones that should be at the top of the list.

In dollar terms, using this rating system to help buy and sell stocks over a 16.5 year period would have resulted in $587k from an initial $10k investment.
That’s a hypothetical return though.
Only if everything goes perfectly will the performance reach 27%. In reality, this will likely return 17% after fees, slippage and not being able to get enough of the required stock.
But 17% is still impressive.
The complete rating formula isn’t finished, but it’s certainly close and I’ll be writing a 3 or 4 part series going into each aspect of the rating system and how I intend to use it.
Have a Big Picture of What Type of Stocks You Want to Find
This is an important section.
There are two ways to find companies to invest in.


Leave A Comment