
In the Currency Strength table, the JPY was the strongest currency while the CHF was the weakest. There were some significant changes last month with the USD gaining 7 points and the CAD gaining 3 points while the GBP lost 4 points, the CHF 3 points and the NZD 2 points.
When looking at the currency pairs on a month-to-month basis the USD, EUR, JPY and GBP seem to support a bullish development in the Weekly charts. From these pairs, only the GBP looks neutral in the Weekly chart while the USD, EUR and JPY look strong.
The CAD looks Neutral in the Monthly chart while it looks strong in the Weekly chart.
The AUD and CHF seem to support a bearish development in the Weekly charts.
The support in the Monthly chart may be because of a trend or a temporary pullback in the monthly chart.
Although some good performing currencies may have lost points in the Currency Strength table they remain interesting when looking at all the currencies in the table as a whole. Same for the weak currencies that may have gained points. That is why the Classification of currencies and the Currency Score comparison are important also. We will look at this in more detail.
12 Months Currency Score Strength
The 12 Months Currency Strength and the 12 Months Average are provided here below. For more information check the page Explanation Articles on my blog.
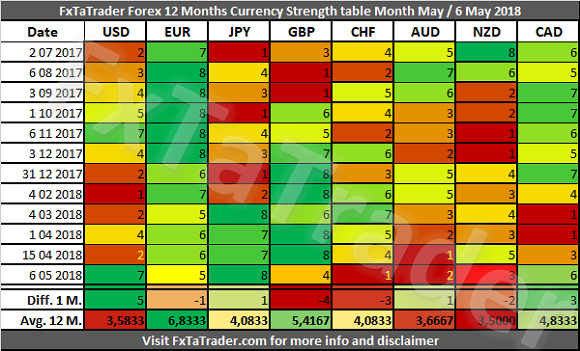
Average 12 M. Score
When looking at the Average 12 M. Score we can see the currencies grouped together according to their classification.
There may be some doubt and in that case it could be a currency that will change its classification in the coming months.


Leave A Comment