Freeport McMoRan Incorporation (FCX) is the world’s largest publicly traded copper and molybdenum producer and it’s also a major producer of gold but almost 70% of revenues are from the sale of copper. The Phoenix, Arizona-based company is primarily engaged in mineral exploration and development, mining and milling of copper, gold, molybdenum and silver, as well as the smelting and refining of copper concentrates.
In the recent two months, Freeport’s shares dropped 27% as it had interrupted the production in Grasberg mine which is the largest gold mine and the third largest copper mine in the world because of a regulatory restrictions in Indonesia on its copper concentrate exports. However, the company recently announced that the matter was resolved as it’s looking to protect and support its past & long-term investment plans in Indonesia and it’s now resuming exports of copper concentrate from. The recent actions helped its stock to bounce, but the move is still weak so let’s take a look a the technical picture using Elliott Wave Theory.
FCX Elliott Wave View
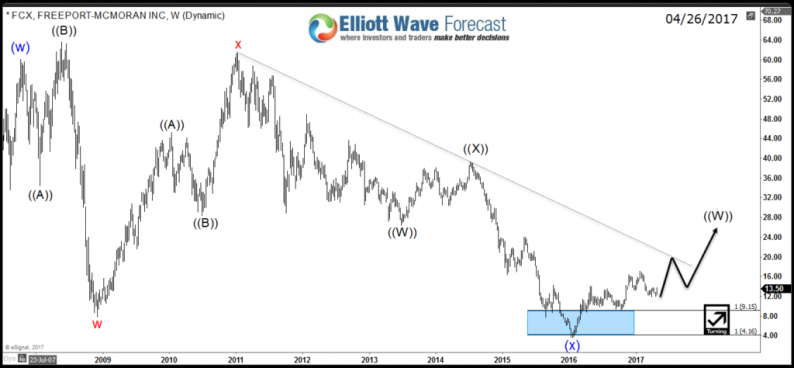
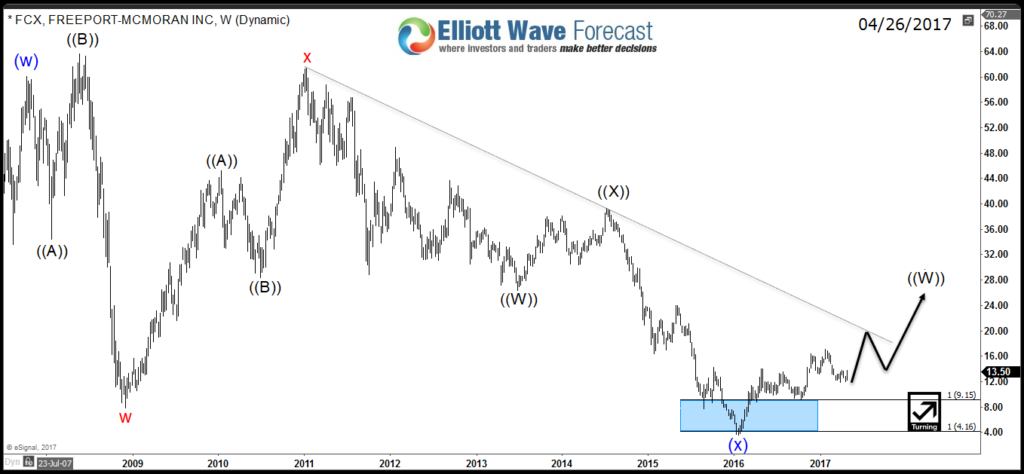
Weekly Chart: FCX did a double three structure from both 2007 & 2011 peaks and managed to reach both equal legs target at $9.15 & $4.16 with 7 swings already in place before finding a bottom early last year. Since then the stock managed to rally and it both cycles from the peaks already ended even the price level still didn’t break above the descending trend-line . Consequently the sentiment for the stock is turning bullish and it should be looking for a bigger 3 waves correction toward the 50% area around $32.
Daily Chart: The stock is showing 5 swing bullish sequence from January 2016 low and will remain supported as long as October 2016 low keeps holding. Currently it ended a flat correction in wave ((X)) and would ideally resume the move to the upside looking for a target at equal legs area 19.82 – 22.24 to end 7 swings sequence around the weekly trend-line and start a 3 waves pullback.


Leave A Comment