
GBP/USD Daily Chart
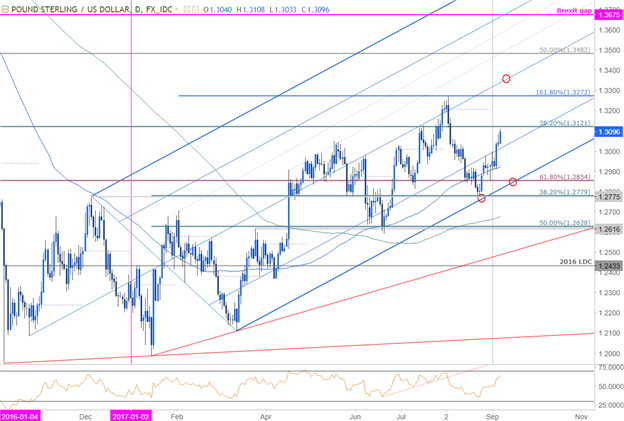
Technical Outlook: Last month we noted that Sterling prices were approaching a region of key, “structural support at the December high / lower parallel at 1.2760/75– a level of interest for possible exhaustion.” Indeed prices registered a low of 1.2773 before reversing sharply higher with the advance now approaching initial resistance targets at 1.3121– a level defined by the 38.2% retracement of the Brexit decline and the mid-July swing highs.
While the immediate risk is for some pullback off this threshold, the broader outlook remains constructive while above 1.2854 with a breach higher targeting subsequent resistance objectives at 1.3272 & the median-line (currently ~1.3350s).
GBP/USD240min
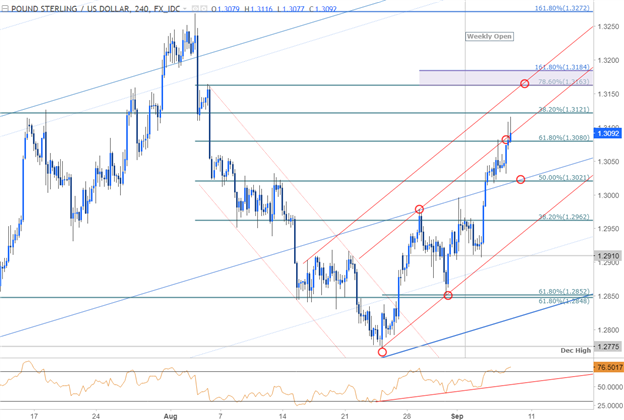
Notes: A closer look at price action highlights a near-term slope extending off the August lows with the rally now testing a parallel extending off last week’s high. Interim support rests at 1.3021 with our near-term bullish invalidation level set to 1.2962.
A breach above 1.3121 still has to contend with a near-term Fibonacci zone at 1.3163/84– a region which could be a bigger hurdle for this advance. Bottom line: from a trading standpoint, I’ll continue to favor buying weakness while within this near-term up-slope (red) with a breach above 1.3184 needed to clear the way for the next leg higher in the British Pound.
—
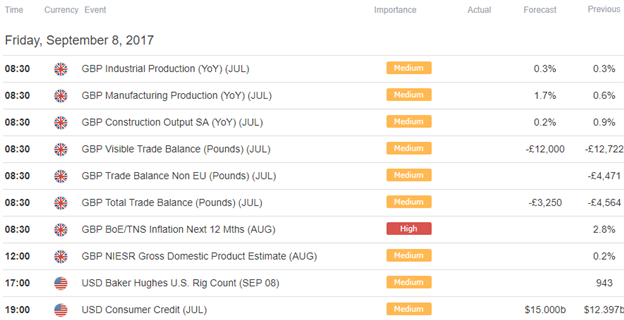
Relevant Data Releases


Leave A Comment