
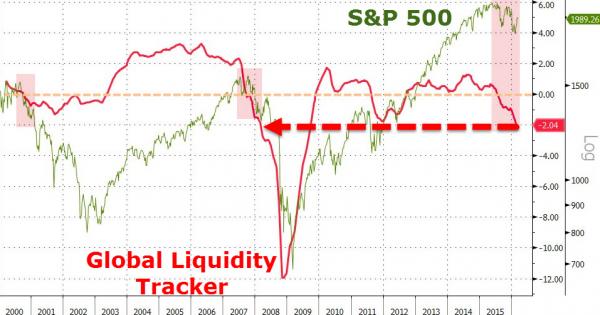
The last time that global liquidity conditions contracted at this pace was March 2008 (right as stocks dead-cat-bounced on the back of The Fed’s guarantee of Bear Stearns’ sale to JPMorgan)… and things escalated rather quickly thereafter.
Liquidity conditions also contracted (though not as severely as the current conditions) in Dec 2011… which prompted Bernanke to unleash QE2…
h/t financialsense.com
Bloomberg defines BofAML’s Global Liquidity Tracker as follows:
Our real-time Global Liquidity Tracker (GLT) is a composite indicator of liquidity conditions in emerging and developed economies. To estimate our GLT indicator, we employ a dynamic factor model used by global central banks. Our Liquidity Tracker extracts a common unobserved factor reflecting the greatest common variation among market spreads, asset prices, monetary and credit data across different frequencies. We combine our US, Euro area, Japan and EM Liquidity trackers into a global composite using financial weights reflecting the average relevance of an economy in terms of market capitalization and private sector credit.
All of this allows us to produce timely estimates of liquidity conditions in an effort to asses the state of the global economy. A reading of zero indicates liquidity at its long-run average while activity between -3 and +3 represents the standard deviation from this average.
Most worryingly – if it wasn’t already obvious, given the world’s stock markets’ total and utter devotion and dependence on central bank-provided liquidity – we have seen this pattern before…
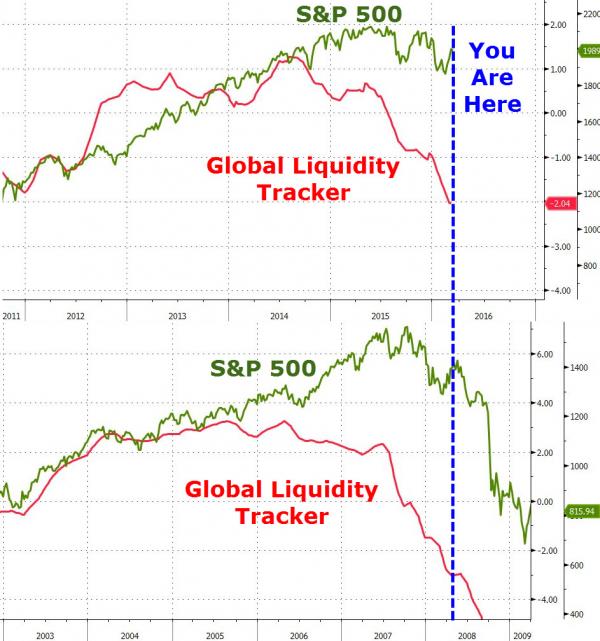
And it did not end well.


Leave A Comment