

Following last week’s analysis, the US Dollar index saw the rally being clipped near the 98.5 – 98.0 resistance. With the Euro turning bullish and the Yen staying flat, the US Dollar Index is starting to look more and weaker with the likelihood of a dip to 94.5 – 94.0 support level. Next week, the FOMC meeting will be the big fundamental risk. The Fed is expected to hold rates steady at the March meeting given that wage growth has not been that impressive. However offsetting the weak wage growth was inflation which has managed to turn positive. The Fed’s meeting will also see the press conference as well as new staff economic projections all of which could build significant noise the week ahead. For the moment, however, the US Dollar Index is likely to consolidate following yesterday’s declines of over 1.02% and a week to date declines of 1.08%.
US Dollar Technical Outlook
The weekly chart shows prices retesting the 98.50 – 98.0 resistance level last week. This week the Dollar attempt to test these levels but was met with strong selling pressure. Price is now trading below the 96.50 key level and limits any upside momentum while clearing the way for a decline to the 94.50 – 94.0 support level. From the weekly chart, the support level will be key. While there is scope for price action to bounce off the support and trade sideways within 98.0/98.5 resistance and 94.0/94.5 support, a downside break following the break of the rising trend line could see further downside which would be very bearish for the Greenback.
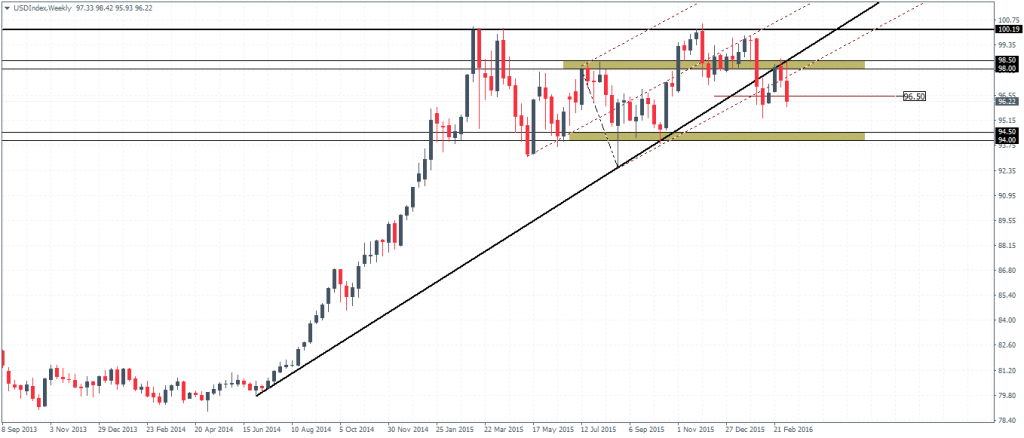
US Dollar Index – Weekly Chart (Retest of the breakout from the trend line)
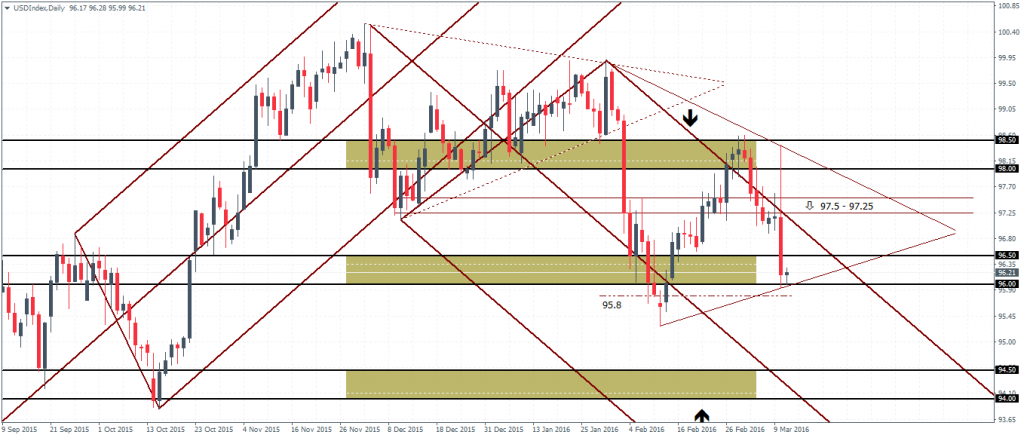
On the daily chart, prices are currently consolidating into another triangle pattern. Any upside gains will see a test of minor resistance near 97.5 – 97.25. Holding the gains here could see a possible break to the downside and below 96.0, the next support is at the 94.50 – 94.0 support.


Leave A Comment