A Rebound Gets Underway – Will It Have Legs?
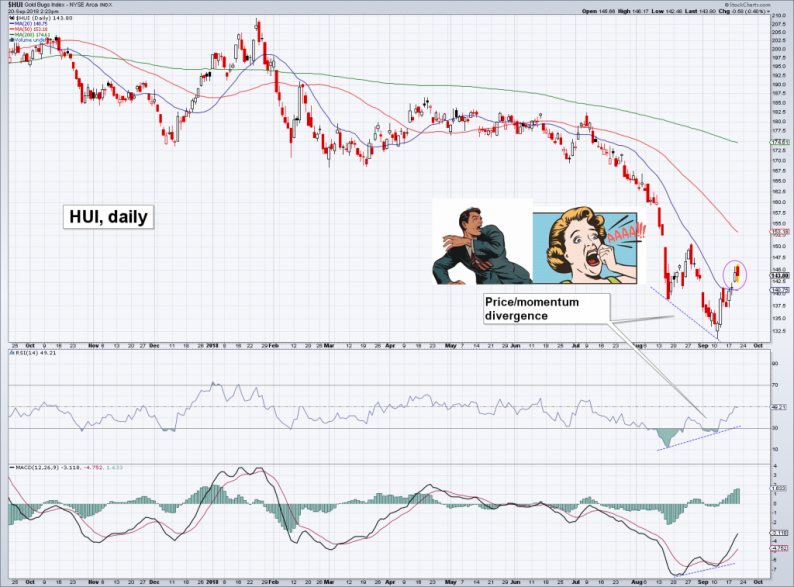
Ever since the gold indexes have broken below the shelf of support that has held them aloft since late 2016 (around 165-170 points in the HUI Index), the sector was not much to write home about, to put it mildly. Precious metals stocks will continue to battle the headwinds of institutional tax loss selling until the end of October, to be followed by the not-quite-as-strong headwinds of individual tax loss selling in the final weeks of the calendar year – a fairly regularly recurring script in recent years. Nevertheless, recent developments make it worthwhile to take another look at the situation. Here is a daily chart of the HUI:

The HUI daily, plus two proxies for gold investors shortly after looking at their end-of-August statements. As the annotation indicates, one reason to take a closer look is the recent strong divergence between prices and momentum oscillators such as RSI and MACD. But that is not the only thing that is of interest.
Apart from the divergence between prices and RSI/MACD at the recent lows it is worth noting that although it feels hesitant, the recent rebound was actually one of the most vigorous rallies of the entire year in a span of just seven trading days.For the first time since early July just before the breakdown, at least two consecutive closes above the 20-day moving average (blue line) could be scraped together, and a third one seems likely at the time of writing.
We have added 50- and 200-day moving averages to the chart as well. These tend to be important for the index, but more importantly, we feel reminded of the situation in late August to late September 2015, when a similar set-up was in place. As we pointed out at the time, the sheer distance of the index to its 200-dma made a strong short term rebound highly likely, even if the medium to long term trend did not change.
The index promptly spiked by almost 40% in early October 2015, which was not even enough to reach its 200-dma; obviously it failed to attain “escape velocity” and fell back almost as fast as it had rallied (aforementioned tax loss selling pressure was a likely culprit). And yet, it was certainly a playable move for nimble traders. Such huge moves in such short time periods rarely (never?) happen in other market sectors.
Futures Positioning – Speculators at Odds With Each Other
According to the legacy CoT report large speculators have completely abandoned their net long exposure to gold futures, going slightly net short for the first time since gold prices crossed the $270 level to the upside more than 17 years ago. The disaggregated CoT report splits large speculators into two major groups – and it turns out these groups strongly disagree on the future direction of prices.
The “managed money” category (which includes CTAs, hedge funds, etc.) has amassed the largest net short position in at least the history of the disaggregated report, which begins in 2006. Over the past two weeks these traders have slightly reduced their downside exposure, but their net short position nevertheless remains at an extremely high level:


Leave A Comment