
Marquee commodities did not find sufficient inspiration for trend development on the first day of the trading week. Gold prices marked time, unmoved by the day’s offering of Fed-speak and seemingly waiting for Friday’s US inflation and retail sales data before committing one way or another. Crude oil prices edged up a bit but ultimately failed to sustain momentum as traders await API inventory flow data and monthly EIAreport on short-term supply and demand trends.
Official figures from the US Department of Energy due Wednesday are expected to show raw-material storage shed 3.4 million barrels last week while gasoline stocks added 2.9 million. That will offer a benchmark for the API release. Supply chain dynamics have been more market-moving than individual readings lately. A small draw at the top relative to a big build at the bottom may hurt prices, for example.
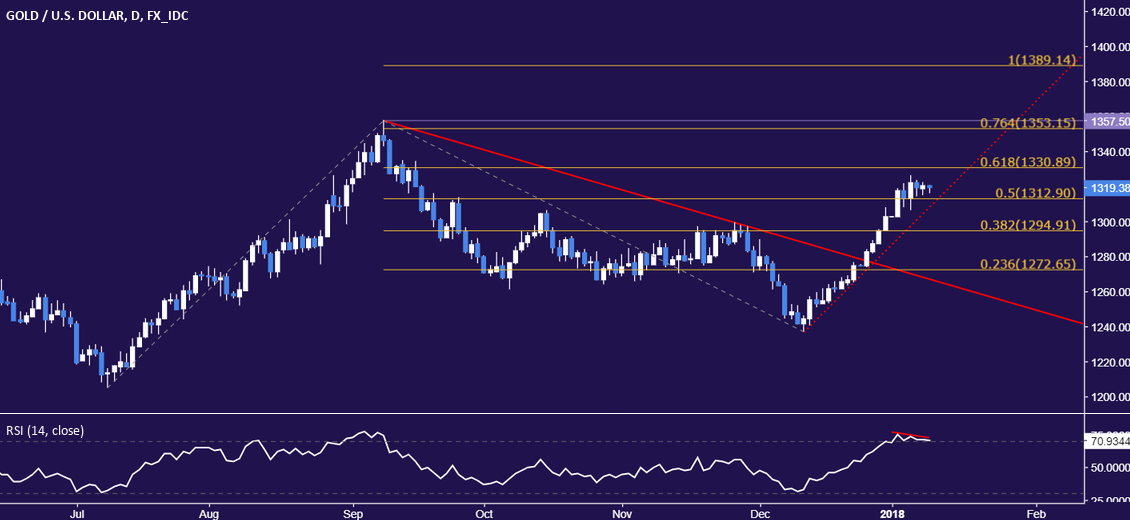
GOLD TECHNICAL ANALYSIS – Gold prices continue to hover below four-month highs established last week, with negative RSI divergence hinting that a pullback may be brewing. A daily close belowthe 50% Fibonacci expansion at 1312.90 puts the 38.2% level at 1294.91 back in the crosshairs. Alternatively, a return to the offensive that takes prices above of the 61.8% Fibat 1330.89 exposes the 1353.15-57.50 area (76.4% Fib, September 8 high).
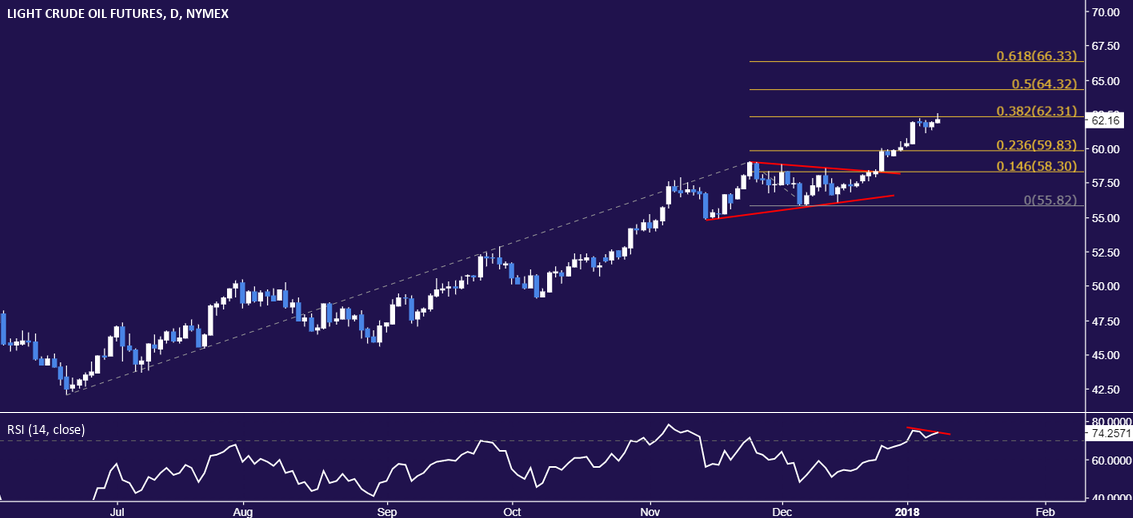
CRUDE OIL TECHNICAL ANALYSIS – Crude oil prices are struggling to build higher after rising to a 2.5-year high, with negative RSI divergence now warning a turn lower may be ahead. A drop back below the 23.6% Fibonacci expansion at 59.83 exposes the 14.6% expansionat 58.30 anew. Alternatively, a daily close above the 38.2% Fib at 62.31 targets the 50% expansion at 64.32.


Leave A Comment