Two weeks ago, regarding the miners we wrote:
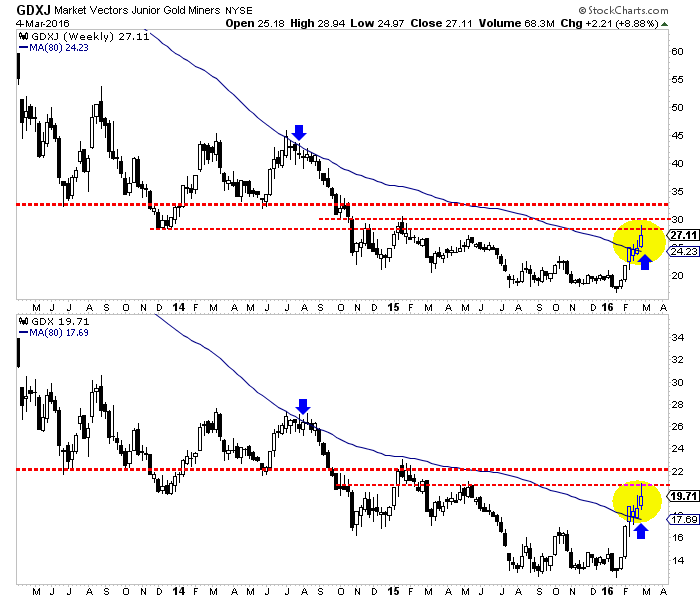
If it (GDXJ) surpasses its 80-week moving average then its next target is $27-$28. Meanwhile, GDX is holding above previous resistance at $18. Its next strong resistance targets are $21 and $22.
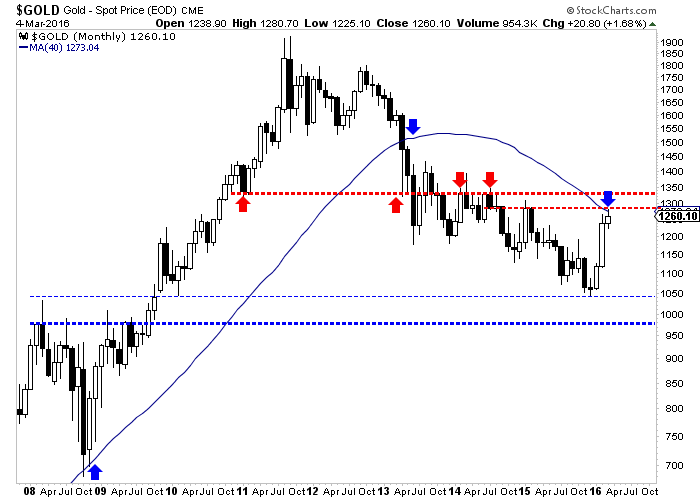
Earlier GDX and GDXJ came within pennies of $21 and $29 respectively while Gold touched $1280 before reversing. While Gold and gold stocks could continue a bit higher, their rebound may have ended Friday morning.
A weekly candle chart of GDXJ and GDX is below. The miners over the past six weeks have formed six white candles and taken out their 80-week moving averages, which contained the strongest rallies during the bear market. However, the miners formed a nasty reversal on Friday after touching resistance earlier in the day. The miners could, at the least, test their 80-week moving averages which are now support.

The recent rebound was similar to that from the October 2008 lows. Then, GDX rebounded 69% (from low tick to high tick) in five weeks while over the past six weeks GDX surged 68%. Then, GDX corrected 20%. GDX also corrected 29% during that rebound. In recent weeks GDX has not corrected more than 10%. It would not be unreasonable for GDX to correct 20% or even 25% from Friday’s high.
Meanwhile, Gold reversed course after reaching a confluence of resistance which includes the 40-month moving average. There remains a small chance that Gold could test $1300/oz before correcting. Gold has support at $1240/oz and $1200/oz.
The bearish reversal at resistance coupled with history makes a strong argument that gold stocks could correct recent gains in the days and weeks ahead. A 20% decline would be normal and reasonable given the context. For those of us waiting for a correction, it could be coming. The month of March may provide the best buying opportunity in the miners since December 2015.


Leave A Comment