One of the most remarkable time series we have seen in 2017 regards the net positioning of non-Japanese investors in Japanese equities.1
In terms of net investor flows over the course of a given year, this indicates a rather high level of volatility, telling us that the perception of the opportunity in a Japanese equity investment has changed massively depending on the time of year in 2017.
The Tricky Aspect of Japan: Yen vs. U.S. Dollar Exchange Rate
One of the easiest measures for investors outside of Japan to monitor is the exchange rate between the yen and the U.S. dollar. We wrote recently about how there is currently a very high correlation between the level of the U.S. 10-Year Treasury note and the level of the yen versus U.S. dollar exchange rate.2
As of this writing, this exchange rate is about 111.5. During the last three months, the yen has been as strong as 107.8 and as weak as 114.2. Before Abenomics began, during the fourth quarter of 2012, the yen was all the way around 80. Sometimes, we get the impression that non-Japanese investors would have preferred to see a nice, smooth trend from 80 all the way up to 130 and continuing.3
Since this hasn’t happened, other very positive aspects of Japan’s equities have been masked, in our opinion.
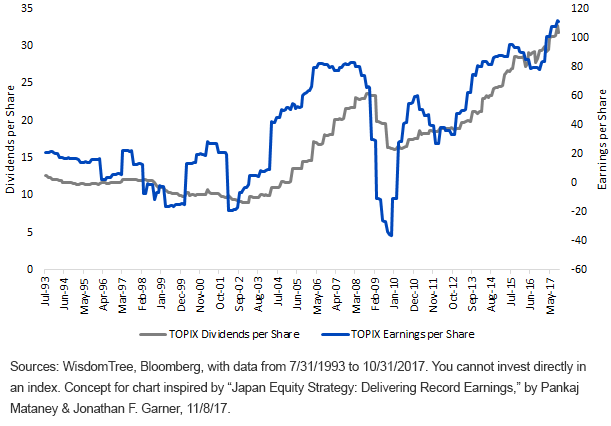
TOPIX: Record High Dividends & Earnings per Share (July 31, 1993, to Oct. 31, 2017)


Leave A Comment