Welcome to edition 291 of Insider Weekends. Last week we mentioned that the big drop marked the worst start of the year in the history of the S&P 500 index and the trend continued this week. The 9 day drop in the S&P 500 this year is also the worst in history. In isolation, this data point means little and it is hard to extrapolate this performance to the rest of the year. There are many factors that could cause the market to weaken further or recover. Will the fed continue raising rates? Will China’s economy continue to weaken? Will Canada see its real estate bubble pop? Will the U.S. dollar continue to strengthen? Will North Korea continue its chest thumping leading to an arms race between the Koreas? Has the commodities bear market bottomed? Will investors flock to Europe on account of further monetary easing across the pond? Each of these events will have an impact on the direction of the market but from the vantage point to a six year old bull market, the risk appears to be on the downside.
Insider buying declined last week with insiders buying $66.27 million of stock compared to $132.61 million in the week prior. Selling also decreased with insiders selling $212.11 million of stock last week compared to $439.57 million in the week prior. This is the lowest amount of insider selling we have seen in over four years.
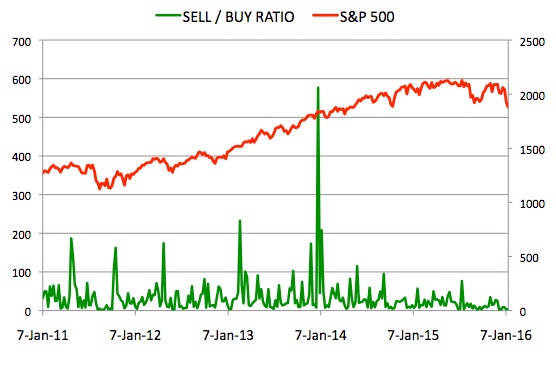
Sell/Buy Ratio: The insider Sell/Buy ratio is calculated by dividing the total insider sales in a given week by total insider purchases that week. The adjusted ratio for last week dropped to 3.2. In other words, insiders sold more than 3 times as much stock as they purchased. The Sell/Buy ratio this week compares favorably with the prior week, when the ratio stood at 3.31. We are calculating an adjusted ratio by removing transactions by funds and companies and trying as best as possible only to retain information about insiders and 10% owners who are not funds or companies.

Note: As mentioned in the first post in this series, certain industries have their preferred metrics such as same store sales for retailers, funds from operations (FFO) for REITs and revenue per available room (RevPAR) for hotels that provide a better basis for comparison than simple valuation metrics. However metrics like Price/Earnings, Price/Sales and Enterprise Value/EBITDA included below should provide a good starting point for analyzing the majority of stocks.


Leave A Comment