Earlier this week, Bank of Canada president Stephen Poloz testified before the Canadian parliament, discussing the latest Monetary Policy Report. He noted that, due to weak exports, low oil prices and a shift in governmental housing policy, the Bank was lowering their growth projections. But it also appears that after an oil price slide induced recession, the worst may be over. And a closer look at the underlying statistics reveals an economy that is slightly healthier than the Bank’s assessment.
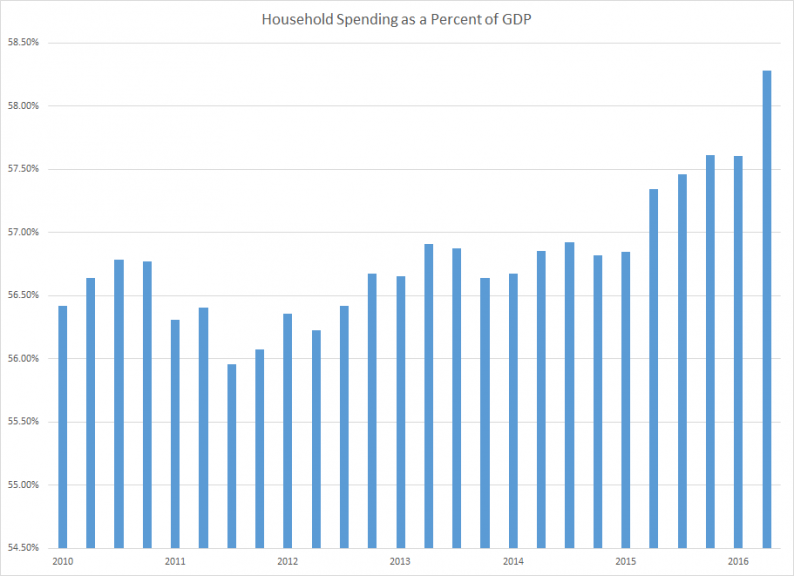
Household spending is doing well:

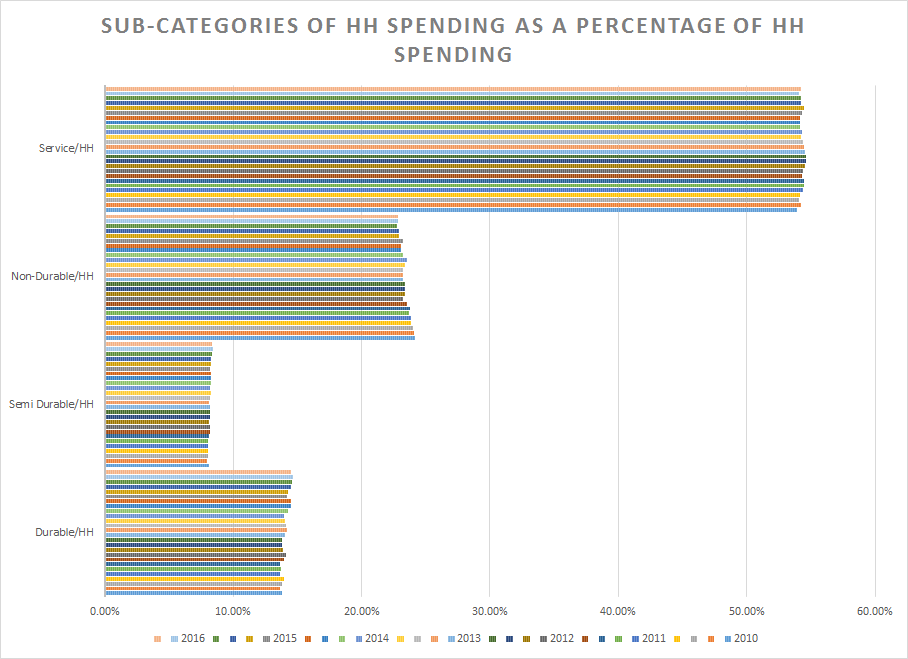
The top chart shows household spending as a percent of GDP since 2010. It’s risen from slightly below 57% in 2010 to over 58.5% in the latest reading. The bottom chart shows household spending subcategories as a percentage of total household spending for each quarter starting in 1Q10 (the lower bar in each category is the earliest total). The overall composition of spending has changed: since 2010, consumers slightly increased their consumption of durable goods and slightly decreased their consumption of non-durable goods. But this should be seen in the larger context of increased household spending.
In contrast, business investment has been weak:
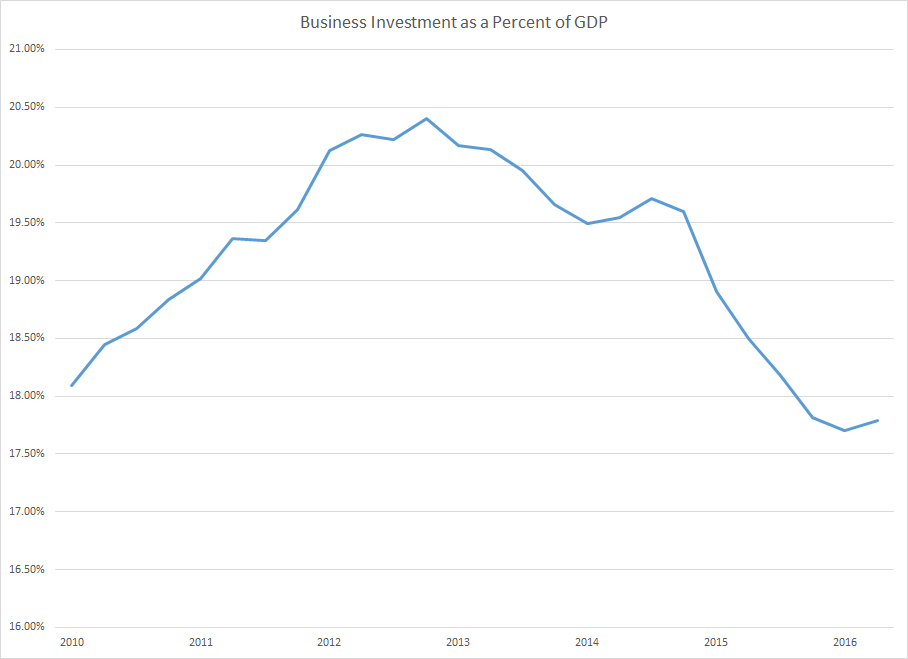
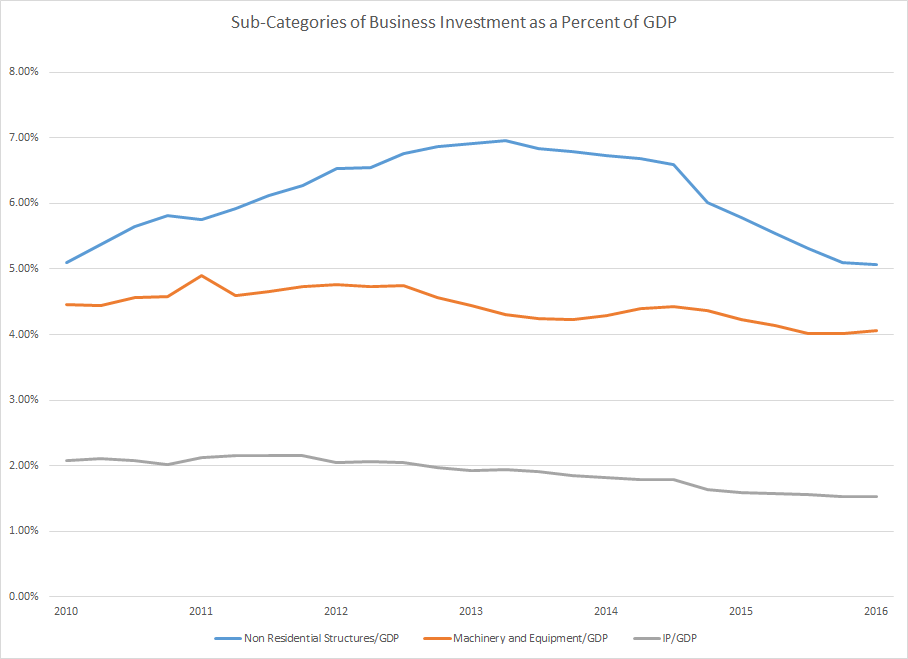
The top chart shows business investment as a percent of GDP, which has arced since 2010: it was slightly above 18% in 2010, increased above 20% in 2013 and fell below 18% in 2016. The bottom charts shows business investment subcategories as a percent of GDP. While non residential structures spending (gold) was the primary driver of the previously described arc, the slight drop in machinery investment (gold) and intellectual property (gray) also contributed.
But overall business weakness is concentrated in manufacturing:
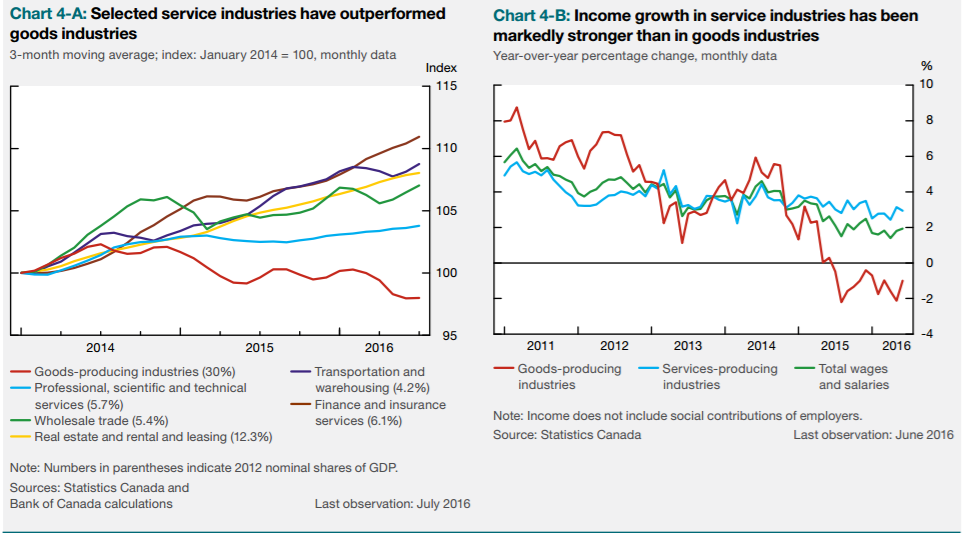
Both charts above are from the Monetary Policy Report; in both, the red line represents the manufacturing sector. The left charts shows overall business activity while the right chart shows income growth.While manufacturing lags in both, the service sector is doing well.


Leave A Comment