
Another Disappointing ISM Report
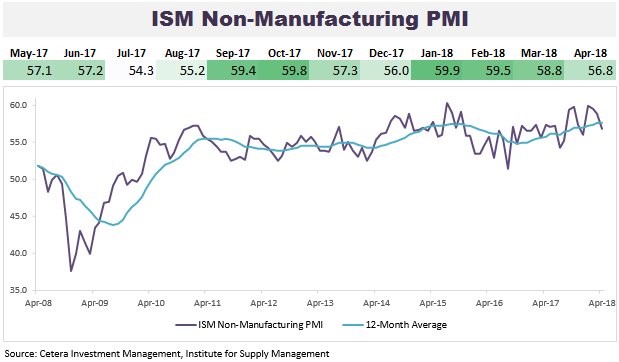
The April non-manufacturing ISM PMI was 56.8 which missed expectations for 58.4. Just like the manufacturing ISM report, it even missed the low end of the range which was 57.3. I’m starting to look for some signs of green shoots in the economy, but we aren’t seeing any in the ISM reports for April. As you can see from the top of the chart below, this is the 3rd straight monthly deceleration. This PMI is below the 12 month average of 57.6. On the bright side, the 12 month average is still increasing.
It’s important to recognize that just like the manufacturing report, this is a report which shows the data going from ‘great to good.’ This PMI is consistent with 2.9% GDP growth which is faster than last quarter’s 2.3% growth, but slower than what the PMI anticipated it would be. That’s a very bad shift in rate of change terms, but we have seen other bouts of weakness without recessions following soon afterwards in this expansion period. I still think there’s almost no chance of a recession in 2018. While that seems to be the consensus, it helps you avoid panicking when the S&P 500 approaches the low end of this recent range or the 200 day moving average. I get optimistic at those levels as the S&P 500 nears long term average valuations.
Specifics Of The PMI
The table below shows the details of the non-manufacturing report. Just like the manufacturing report, the new orders index was strong. In fact, it increased 0.5 to 60 which is impressive in a down report. Employment fell 3 points to 53.6 which was similar to the manufacturing report. I will be reviewing the ADP employment report for April later in this article. There was a sharp deviance between each sector of the economy in the backlog category as the manufacturing backlog was up from 59.8 to 62 while the non-manufacturing backlog fell 4.5 points to 52. The services sector isn’t seeing the same pressure on the supply chain as the manufacturing sector. This pressure on the manufacturing supply chain is causing price increases which aren’t as severe in the services sector. While both price indexes rose, manufacturing is at an extreme 79.3 and services is only at 61.8. Considering the fact that inflation isn’t that high, as the core PCE growth is 1.9%, it makes sense to see the non-manufacturing prices index at that level.


Leave A Comment