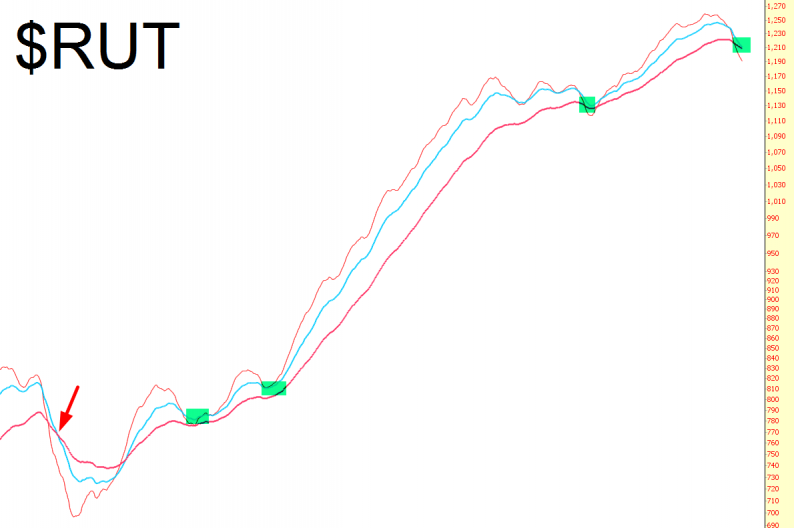
I don’t really use indicators in my trading, but I wanted to take a look at the 50/100/200 day exponential moving average on the Russell 2000. Here’s what I see, and I’ve removed the price data for simplicity and clarity:

What I am focused on is the 100 day EMA crossing beneath the 200 day. This hasn’t happened in a long, long, long time. Indeed, the last time it happened (which I’ve marked with an arrow) was during the debt crisis back in August/September 2011 (Remember those days? When the government actually debated the size of the debt as if we’d ever pay it off someday? Good times, good times…)
Since then, the crossover has come close…very, close, close…but something always saves the day. The last “close call” was during the ebola scare, but Fed Dude Bullard saved the market on October 15th by threatening QE4 unless things shaped up, and shape up they did, in a big, big hurry.
Bulls are naturally confident this time will simply repeat, and they could well be right. All I’m suggesting is that we keep an eye on this, because there’s still a chance that, for the first time in four freakin’ years, we actually start to get some actual downside momentum instead of our umpteenth fake-out.


Leave A Comment