

Over the last three weeks, as interest rates surged above 3%, we explored the question of whether something had “just broken” in the market.
As I stated last week:
“This past week has been a decidedly tough struggle for stocks to pick themselves up after last week’s drubbing. While we saw a sharp reflexive bounce earlier this week, that bounce quickly faded as stocks returned to retest support at critically important levels.”
While the market was oversold last week, there was no follow through on bounces which ultimately led to a “crash” open on Friday morning.
Now, all this sounds terrible. And, after having THE single longest uninterrupted bull run in the history of the market with record low volatility it FEELS even worse.
So, before we get into the not so good news, let’s keep this all in perspective for a minute.
For the year:
What has been different this year so far, is that bonds, while they have reduced the volatility of the recent decline in the S&P 500 index, have not contributed to portfolio returns this year so far. So, the only place to hide has been cash.
However, if we take a look at the market from 2009 to present, we can gain some better context.
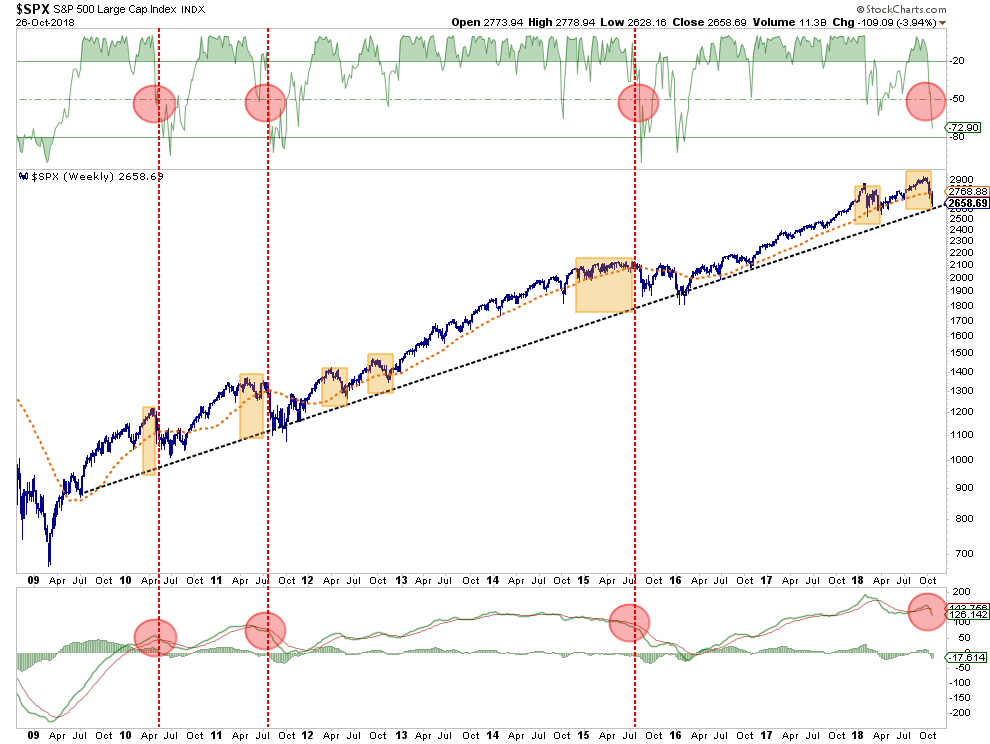
The recent decline is very much like the previous corrections in the market. The red circles denote when both “sell signals” align (a correction of overbought conditions and a triggered sell signal). These corrections have specifically coincided with periods where the market was extremely deviated above the running bullish trend line (gold boxes.)
Currently, the correction, while painful in the short-term has been nothing more than a correction back to the running bullish trend.
So why worry?
The “difference this time” is significant:
I could go on, but since you want “short and to the point,” I will stop there.
Here are some simple observations from Doug Kass (click here for recent interview) which dovetails into the following market analysis.
Daily View
In early October, the market broke the bottom of the previous short-term bullish trend channel and tested initial support at the 61.8% retracement level of the push higher from the April lows. That move failed at the 38.2% retracement level and has now violated previous support this past week. This is not a good development and suggests that a failed rally back to that previous support will set the markets up for a retest of the April lows.


Leave A Comment