

People ask me all the time why I write so much.
Here is the funny part, when I write I am writing for me. The process of writing helps me distill down the daily barrage of financial information into a more focused analysis to help me in the management of portfolios.
From time to time my writings are picked up by other sources, which is both flattering and humbling, which leads to comment threads by readers. These comments are the most enlightening and educational parts of my day.
I have learned two things in particular.
The first is there is a visible dichotomy between those who lived through the “Financial Crisis”and those who made their first investments afterward. The former has a clear understanding of what happens to capital during a major market correction and the effort required to recoup those losses. The latter has a clear belief “this time is different” and the market can only go higher from here.
The second is there is clear misunderstanding of the difference between “understanding and recognizing risks” and investment posturing (aka being “bearish.”)
Currently, our portfolios are nearly fully allocated. As I have discussed over the last couple of months we have added “risk off” trades due to the extreme bifurcation in the markets. We have also added Russell 2000 and international exposure along with various sector exposure and broad market coverages.
This is hardly bearish by any means.
As such, if the market continues to rise, that’s great for my clients and my portfolios.
But telling you why the market will keep going up is hardly a useful exercise. For that simply turn on any financial television program or read any mainstream financial publication. Bullishness always reigns. Maybe you should ask yourself why? (Optimism sells products, services, and advertisers.)
For me, when I write, I am analyzing the data for where I could be wrong in both my short, as well as my intermediate-term, outlook. That doesn’t make me bearish, although it may sound that way. What you are reading is my struggle to battle “confirmation bias.”
And…that is where we are today.
The Bullish View
As I noted last week:
“A ‘buyable correction’ would suggest a correction back to recent support levels that keep the overall ‘bullish trend’ intact.“
It is the last part of that sentence which is most important in the SHORT-term.
As the monthly chart of the S&P 500 shows below, the bullish trend currently remains firmly entrenched. The market continues to trade above the running bullish trendline AND the 24-month moving average. Currently, it would require a break below 2100 to suggest a change of trend is in the works.
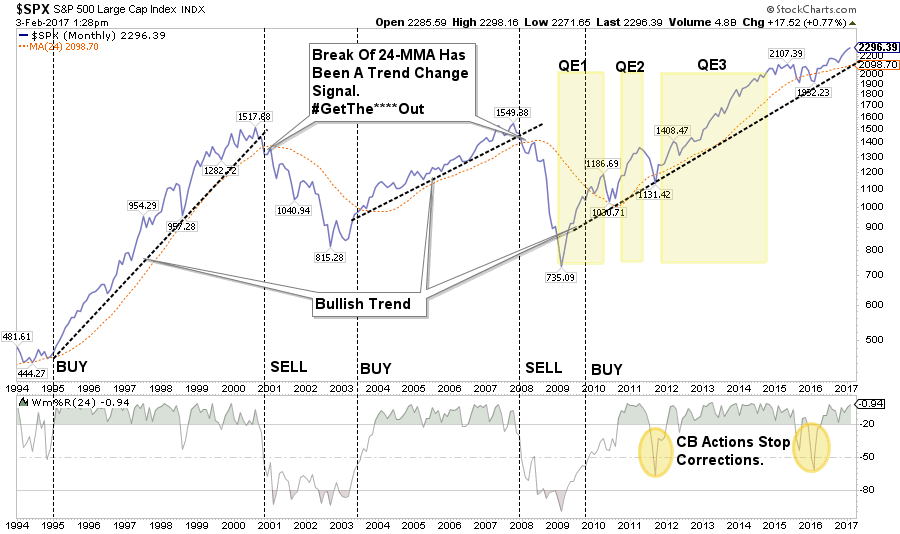
This short-term bullish trend mandates that portfolios remain exposed to equity-related risk as long as corrections do not violate either the 24-month or upwardly trending bullish trend.
Rule #1: In a bullishly trending market portfolios should only be long or neutral.
However, eventually, something will happen to “change the trend” from upwardly sloping to downwardly sloping which will be identifiable by a break of the supportive trendlines. In such a case the second rule applies:
Rule #2: In a bearishly trending market portfolios should only be neutral or short.
For now, the markets are clearly bullish as optimism and exuberance reign.
The Bearish View
It is the over-optimistic and exuberant outlook currently that gives me caution as to the intermediate and long-term views. As noted last week by Brad Lamensdorf there are multiple indications that suggest a much higher degree of long-term caution. To wit:
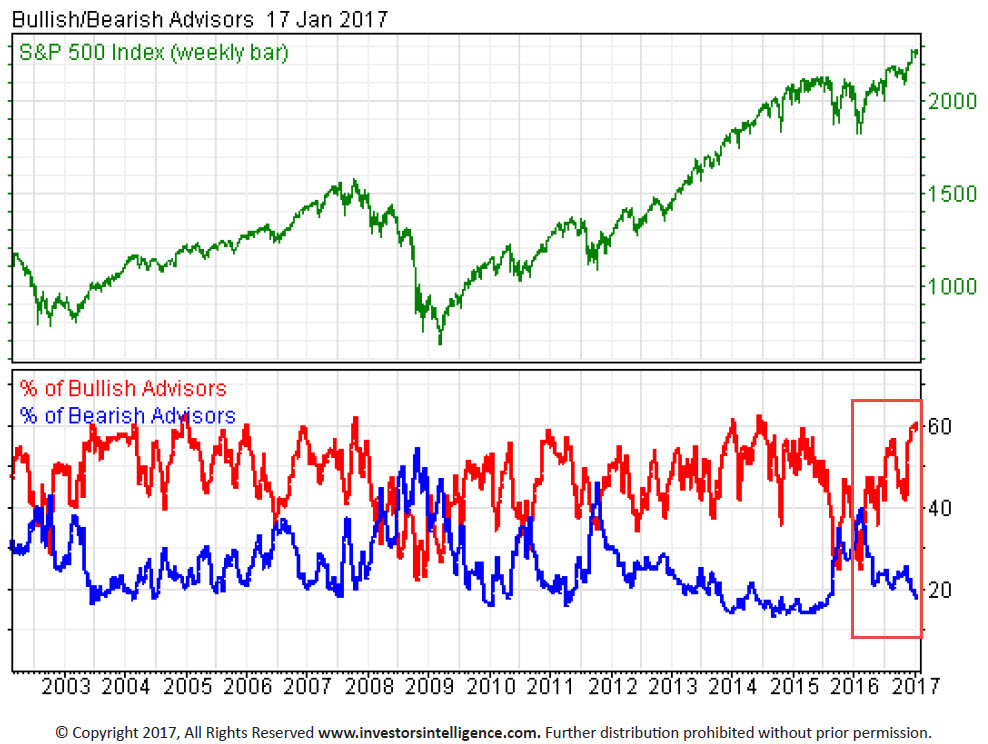
“Extremely high positive sentiment remains problematic, suggesting that a significant amount of funds available for investment have already been committed. As we’ve mentioned, sentiment is a contrarian indicator, and extremes typically mark tops and bottoms. Bullish newsletter writers stand at 60.6%, which is an 18-month high. Bearish newsletter writers have fallen to just 17.3%.“
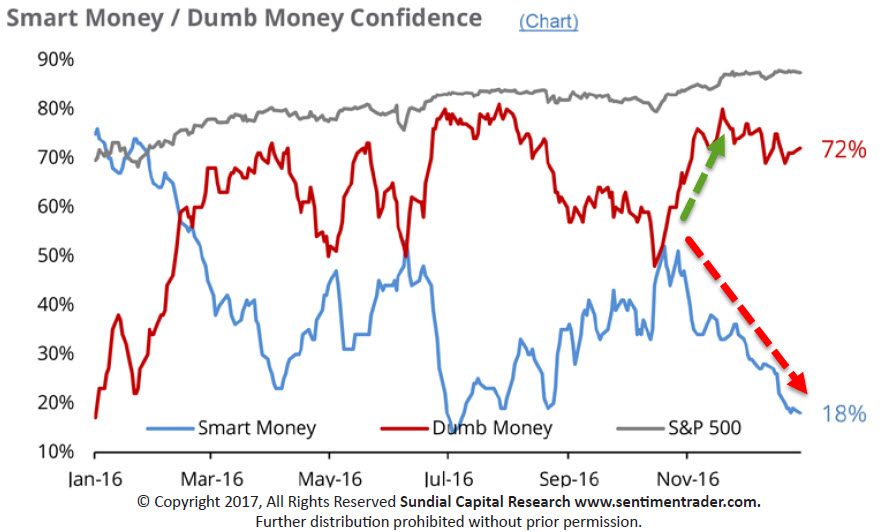
“The bull/bear ratio is now in the danger zone at 43.3%. The smart money/dumb money confidence gauge, a proprietary indicator published by sentimentrader.com, reinforces our view on sentiment. The current spread is exceedingly high, which is another negative for sentiment in general.”
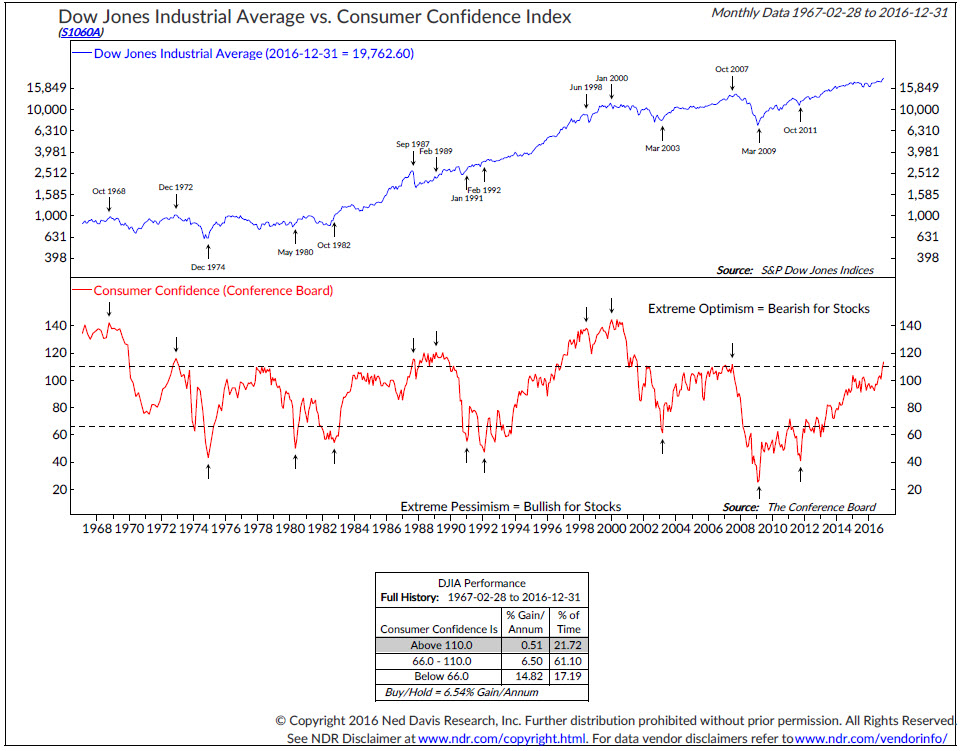
“The consumer confidence index measures the confidence level of the general public on the economy based on spending and savings. This tool is not directly linked to the stock market. However, it can be useful for spotting when expectations have become too extreme in positive or negative directions. The current reading of 113 is at its highest in over 15 years. Going back further one can clearly see the elevation of the index in the 1980’s and 1990’s, recessions occurring at each point thereafter. Extremes typically occur at the beginning or end of a trend. Current expectations are definitely running high!”
“Unlike earnings, which can be easily ‘massaged’, sales are much more difficult to manipulate. The price-to-sales on the S&P500 is at its second highest in history, rivaled only by the 2000 bubble.”


Leave A Comment