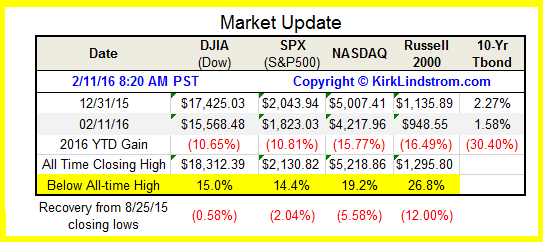
Currently, on an intraday basis the S&P500 is down 14.4% from its record high.

Note how the Russell 2000 small cap index is in a bear market, down 27% from its all-time high and 12% below its 8/25/15 low.
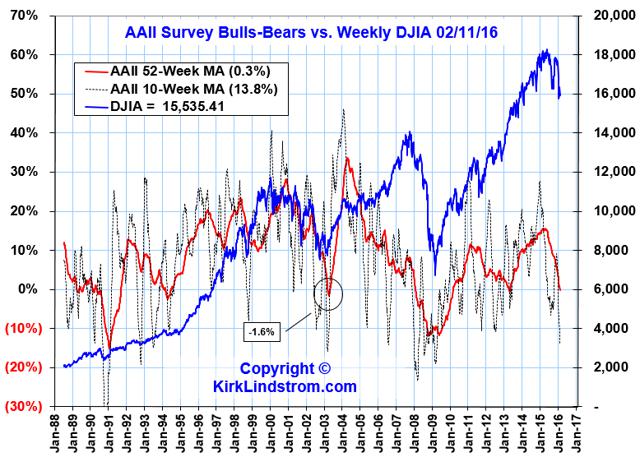
Every week I review my sentiment charts of the weekly data. In this article, I compare the sentiment levels from various surveys in my table to get an idea of overall investor sentiment.
See all the charts and sentiment indicators at
Continue reading this article With SPY Down 14% Again, Sentiment Charts Suggest Another Tradable Low.


Leave A Comment