In the darkest days of the Great Depression, Franklin Roosevelt’s first inaugural address exhorted the country to look unflinchingly toward recovery by saying “the only thing we have to fear is fear itself.”
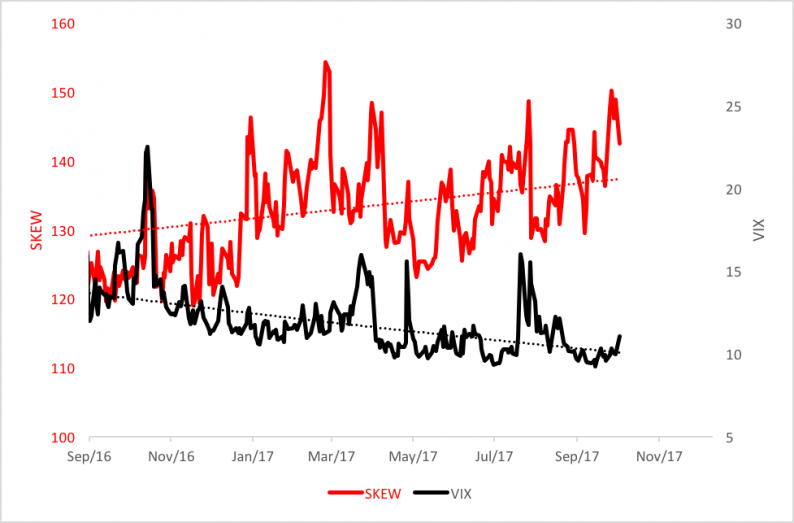
We’re now in a very different place than 1933. Our stock market is exuberant. Fear, as measured by the well-known CBOE Volatility Index (VIX), has been downtrending to record lows since last year’spresidential election.
VIX is based on the real-time prices of options on the S&P 500 Index (SPX) and reflects investors’ expectations of equity market volatility over the ensuing 30 days. Historically, VIX is negatively correlated to the stock market, thereby earning its sobriquet as the “fear gauge.”
You can trace VIX’s downtrend as the black line in the chart below.

So do investors have to worry about?
The red line in the chart above, that’s what. That line scribes the trajectory of the CBOE Skew Index (SKEW), another indicator derived from SPX option prices. SKEW tracks S&P 500 “tail risk”—outlier returns of two or more standard deviations below a normal distribution’s mean.
Huh?
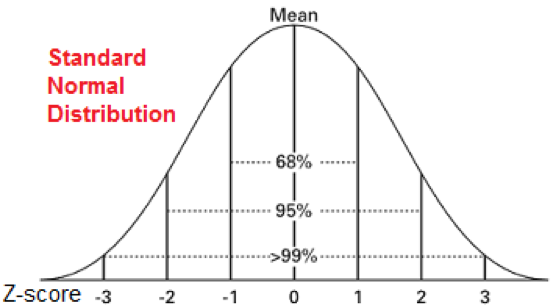
Below you’ll see a normal return distribution—a classic bell-shaped curve—characterized by a bulge where about two-thirds of returns can be found within one standard deviation (Z-score) of the mean or average. “Tails” extend outward to the right (the positive direction) and to the left (the negative direction). Only 5 percent of returns are expected to fall beyond two standard deviations from the mean in a normal distribution.
SKEW’s price typically varies from 100 to 150 with 100 representing investors’ perception of a normal curve and negligible risk for outlying returns.When SKEW rises above 100, the left-hand tail of the distribution becomes “fatter” as the odds of outliers rises.


Leave A Comment