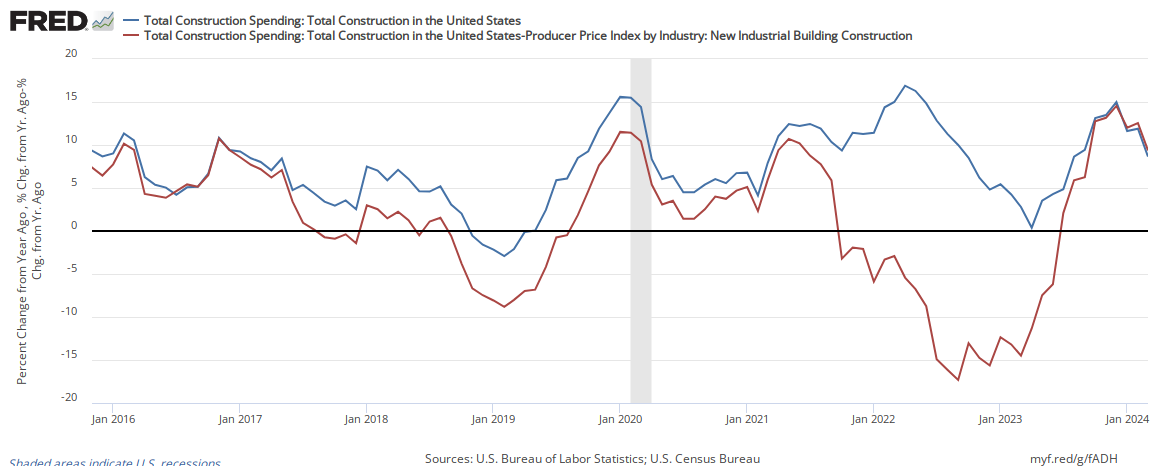
The headlines say construction spending was up and within expectations. Our view is that this does not consider inflation.

Analyst Opinion of Construction Spending
There continues to be significant backward revision to the date – this month was slightly upward and did not change the trends. The rolling averages were statistically unchanged.. Also note that inflation is grabbing hold – and the inflation adjusted numbers are showing contraction in this sector.
The employment gains year-over-year are near the same than the year-over-year growth in construction spending..

Econintersect analysis:

US Census Analysis:
Construction spending (unadjusted data) was declining year-over-year for 48 straight months until November 2011. That was four years of headwinds for GDP.
This month’s headline statement from US Census:
Construction spending during November 2017 was estimated at a seasonally adjusted annual rate of $1,257.0 billion, 0.8 percent (±1.2 percent)* above the revised October estimate of $1,247.1 billion. The November figure is 2.4 percent (±1.5 percent) above the November 2016 estimate of $1,227.0 billion. During the first eleven months of this year, construction spending amounted to $1,138.3 billion, 4.2 percent (±1.0 percent) above the $1,091.9 billion for the same period in 2016.
PRIVATE CONSTRUCTION – Spending on private construction was at a seasonally adjusted annual rate of $964.3 billion, 1.0 percent (± 1.0 percent)* above the revised October estimate of $955.1 billion. Residential construction was at a seasonally adjusted annual rate of $530.8 billion in November, 1.0 percent (±1.3 percent)* above the revised October estimate of $525.3 billion. Nonresidential construction was at a seasonally adjusted annual rate of $433.5 billion in November, 0.9 percent (± 1.0 percent)* above the revised October estimate of $429.7 billion.
PUBLIC CONSTRUCTION – In November, the estimated seasonally adjusted annual rate of public construction spending was $292.7 billion, 0.2 percent (±2.0 percent)* above the revised October estimate of $292.0 billion. Educational construction was at a seasonally adjusted annual rate of $78.8 billion, 3.8 percent (±2.5 percent) above the revised October estimate of $75.9 billion. Highway construction was at a seasonally adjusted annual rate of $88.0 billion, 0.8 percent (±4.6 percent)* below the revised October estimate of $88.7 billion.


Leave A Comment