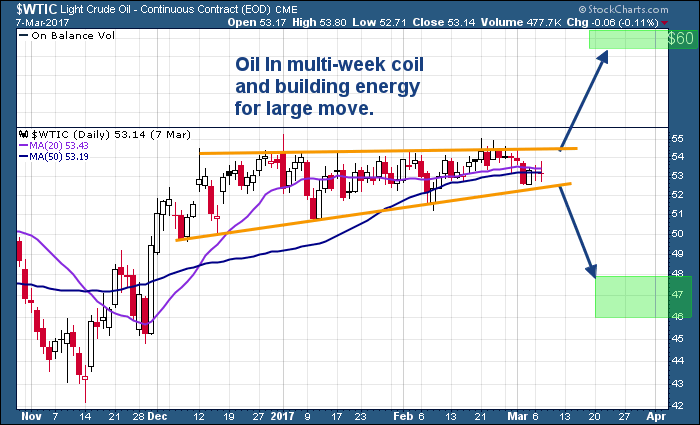
Last weeks move in Crude Oil, down over 8.8% was triggered by new “Record High” US inventory data and news that OPEC production cuts are near 85% compliance have prompted a breakdown. We have been expecting a breakout move for a few weeks and suspected production would outpace demand, as it has been for many months.
Below is the chart of oil we sent to followers last week.

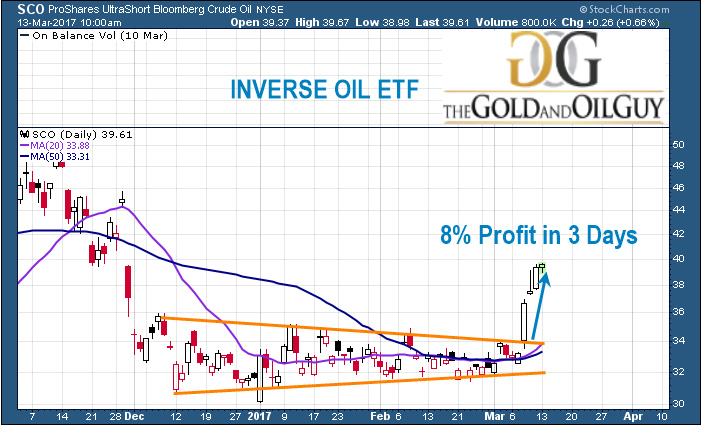
Price of oil after the breakdown which we traded SCO inverse fund
With the weekly EIA inventory report stated a huge 8.2 million barrel inventory increase while production levels are, overall, decreasing.This prompted a continued bearish price slide for Oil and Gas related equities.These moves will setup a number of superior opportunities in the future days and weeks for many traders.Initially, we want to be cautious of the impulse price moves and look to establish strategic trades when the opportunity is perfect.
COP Chart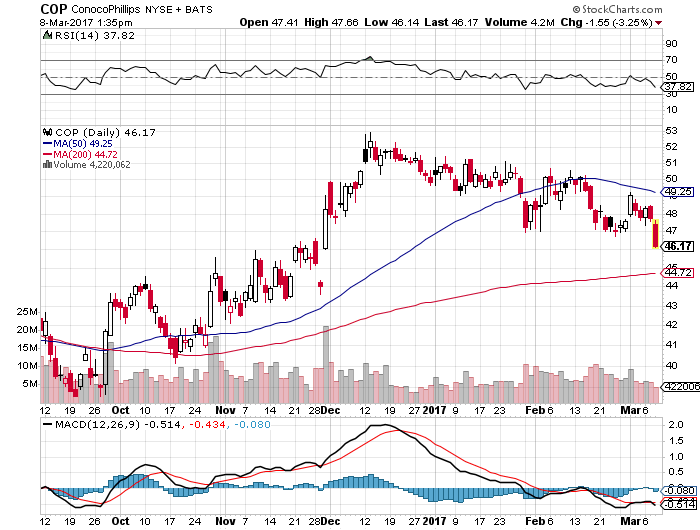
APC Chart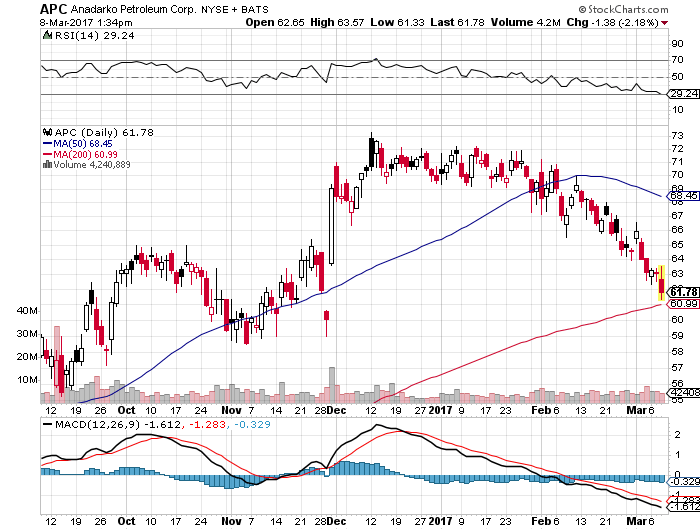
As these price moves play out over the next few days, we urge all traders to be cautious as we are expecting a dramatic increase in global market volatility to begin with just a few days.Our earlier analysis shows a very strong potential for dramatic volatility increases beginning near March 17th.This means these early moves may be “price traps” that catch inexperienced traders.
Most traders will attempt to follow this move and chase it lower.Even though there may be some validity to this method, we’ve found that the optimal entry is based on “Momentum Reversal Strategies”.In other words, waiting for the ideal timing and entry when the markets show signs that a major reversal is about to happen – we call it the Momentum Reversal Method (MRM).
This move in oil is an early warning that traders need to pay attention to.It will likely setup numerous MRM trade setup/entry opportunities over the next few days/weeks.These are the types of price anomalies that allow my MRM trading strategy to hone into finding great trades.


Leave A Comment