
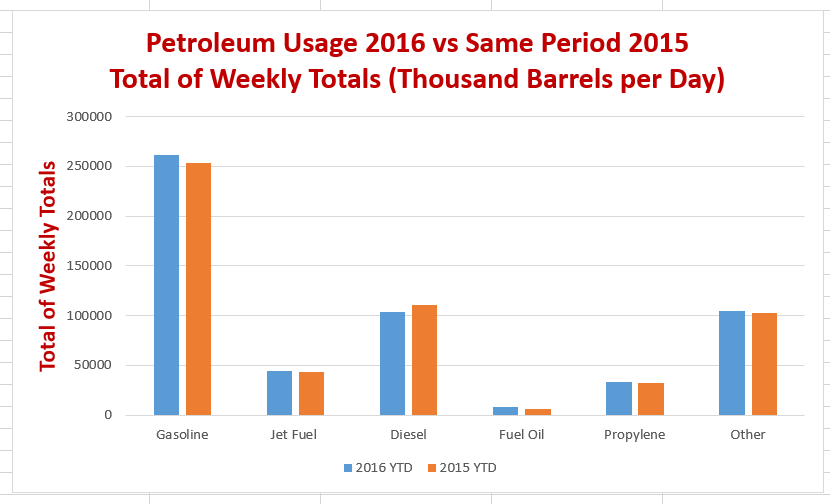
U.S. petroleum usage in 2016 is up in every category this year compared to last year with the exception of diesel.
A couple of charts I produced from the Energy Information Administration (EIA) Weekly Petroleum Report will explain.
Usage in Barrels
Percentage Change 2016 vs. 2015

I left off fuel oil (up 42.95%) as it distorted the chart. As you can see from the first chart, fuel oil is an insignificant amount of the total usage.
Percentage Changes
Diesel usage (primarily truck shipping) is down, all other petroleum usage is up.


Leave A Comment