
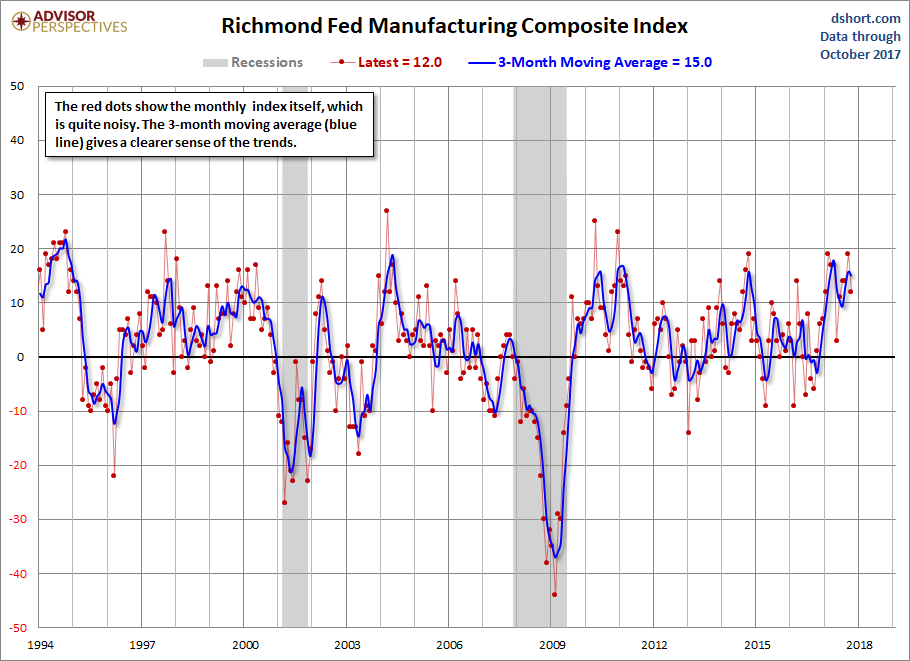
Today the Richmond Fed Manufacturing Composite Index was at 12 for the month of October, down from last month’s 19. Investing.com had forecast 17. Because of the highly volatile nature of this index, we include a 3-month moving average to facilitate the identification of trends, now at 15.0, which indicates expansion. The complete data series behind today’s Richmond Fed manufacturing report, which dates from November 1993, is available here.
Here is a snapshot of the complete Richmond Fed Manufacturing Composite series.
Here is the latest Richmond Fed manufacturing overview.
Reports on Fifth District manufacturing activity remained positive in October, according to the latest survey by the Federal Reserve Bank of Richmond. The composite index dropped, affected by a notable decline in the shipments index, which fell from 22 to 9, but it remained positive across all components, indicating continued growth. While most manufacturing indexes fell in October, the wage index increased from 17 to 24, which is the highest it has been since May of 2000.
Manufacturing firms remained optimistic about growth in the next six months. Most expectations indexes rose, with the exception of employment and average workweek, which both remained positive and were well above current values.
District manufacturing firms reported that prices grew in October, although at a slightly lower rate than during September. They expect price growth to accelerate in the coming six months. Link to Report
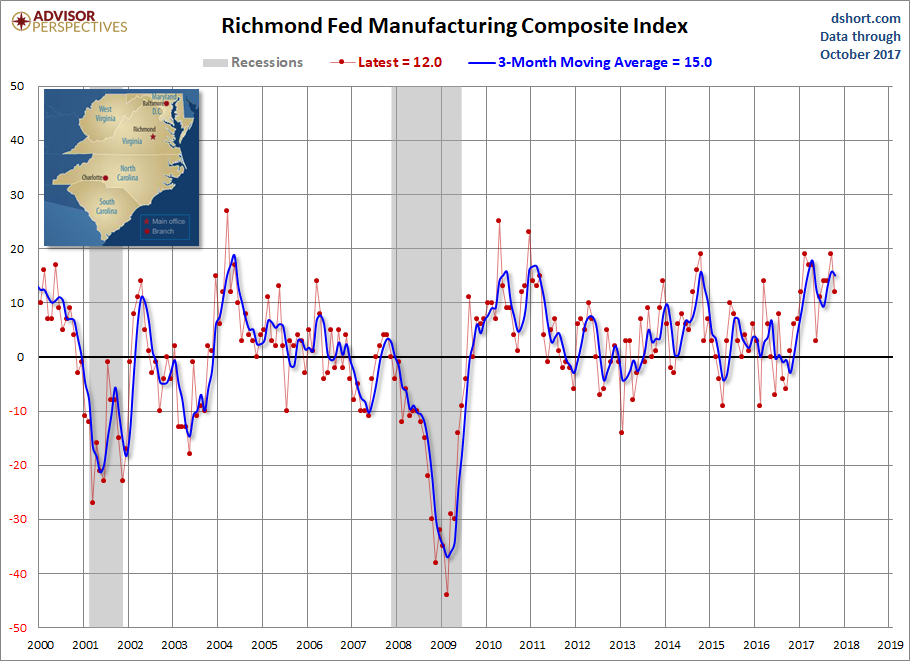
Here is a somewhat closer look at the index since the turn of the century.
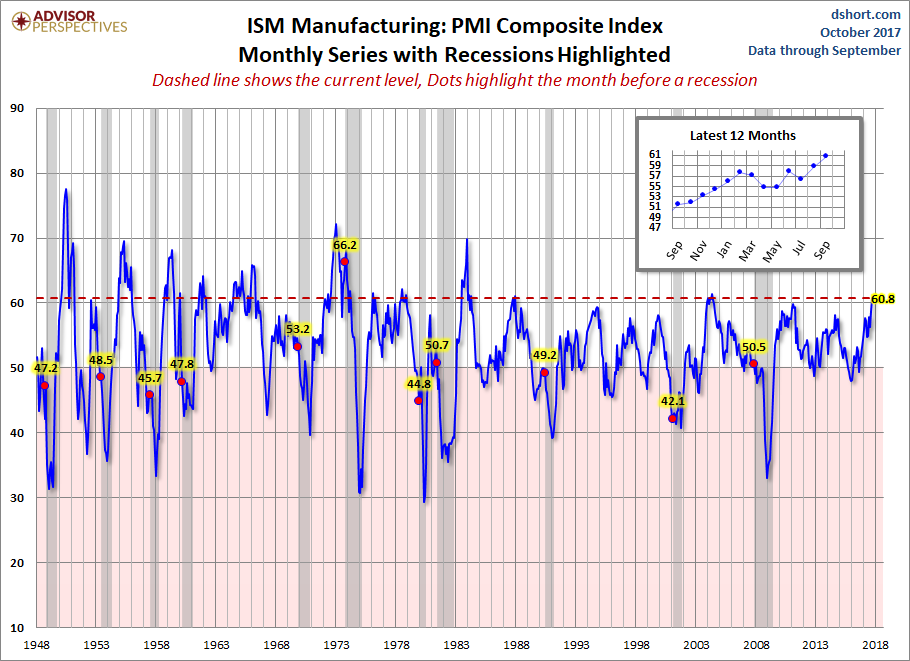
Is today’s Richmond composite a clue of what to expect in the next PMI composite? We’ll find out when the next ISM Manufacturing survey is released (below).
Because of the high volatility of this series, we should take the data for any individual month with the proverbial grain of salt.


Leave A Comment