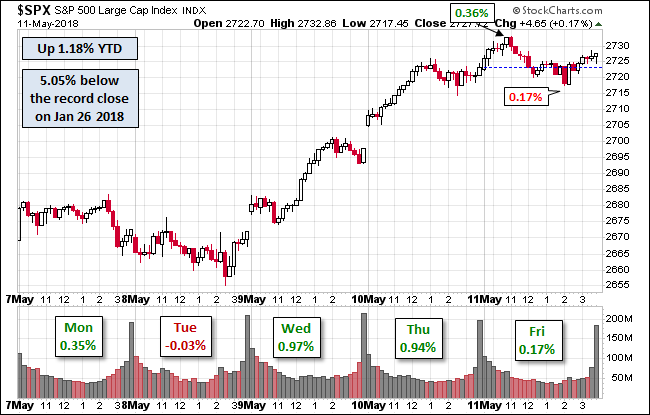
Following yesterday’s flat trading range, the S&P 500 surged at the open and rose to its 0.76% intraday high about 45 minutes later. The index then slowly drifted lower to its 3PM afternoon low and then rose slightly to its 0.38% close. The 500 finished the week with a 3.27% gain, erasing much of the -3.63% loss the previous week.
The yield on the 2-year note closed at 0.93%, its highest level since early May of 2010 and an indication that the bond market is factoring in a December rate hike.
Here is a snapshot of past five sessions.

Here is a weekly chart of the S&P 500, which illustrates the recovery of most of the previous week’s loss, and we see that index bounced off its 10-week moving average.

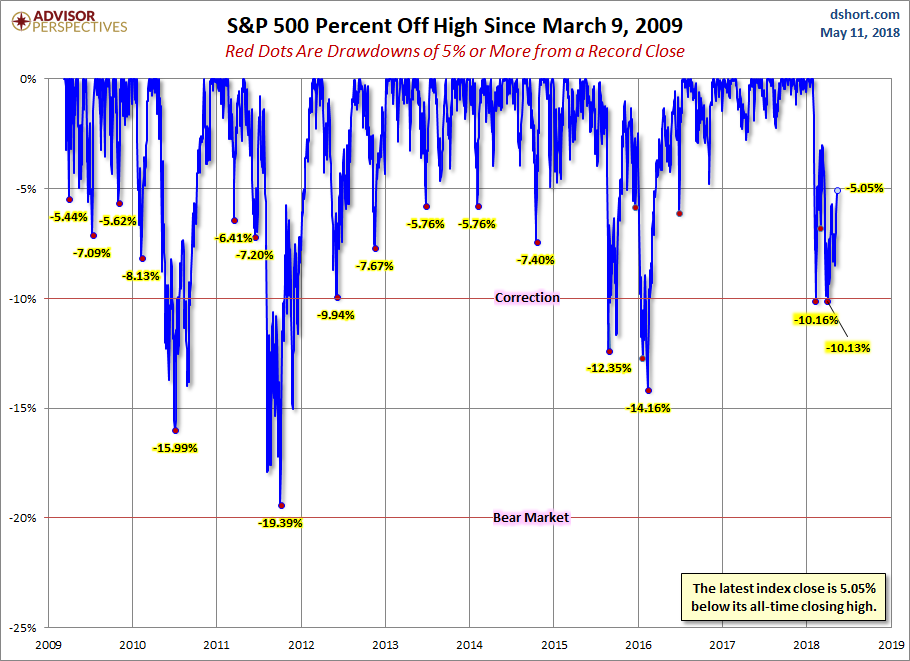
A Perspective on Drawdowns
Here’s a snapshot of selloffs since the 2009 trough.
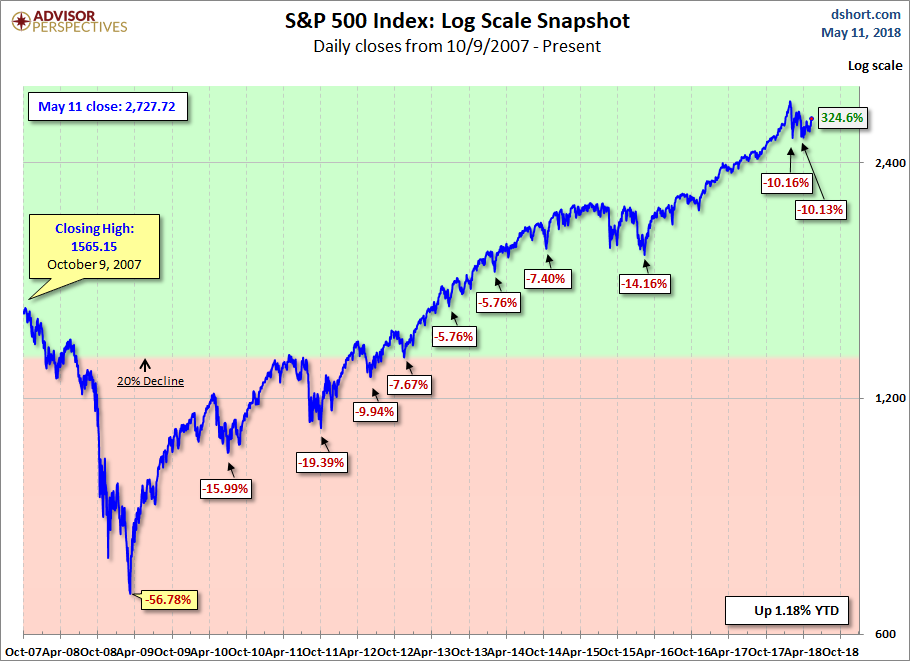
For a longer-term perspective, here is a log-scale chart base on daily closes since the all-time high prior to the Great Recession.
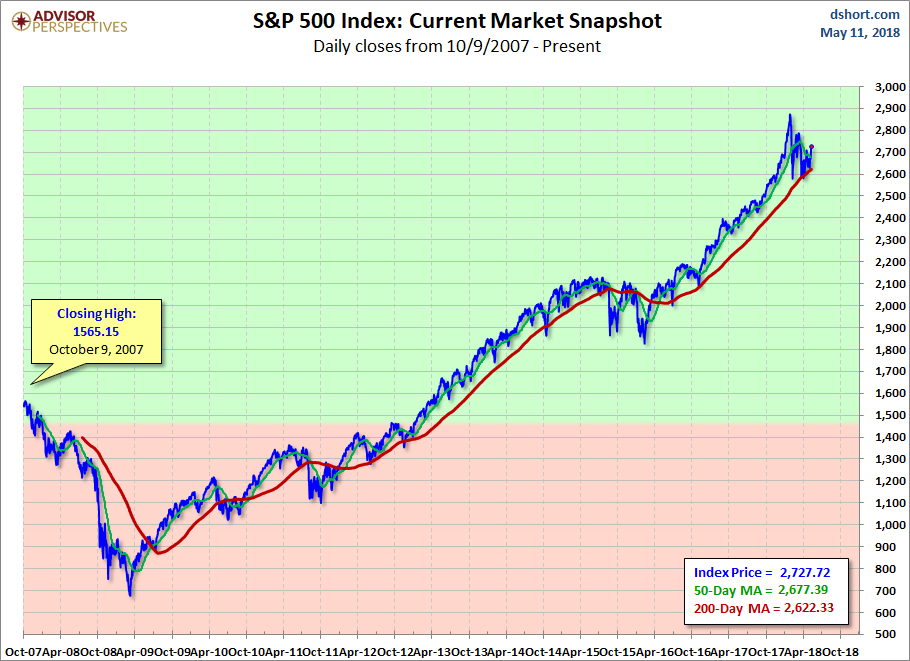
Here is the same chart with the 50- and 200-day moving averages. The 50 crossed below the 200 on August 28th.


Leave A Comment