
Wall Street still exudes widespread optimism that 2017 will provide another year of solid gains for stocks amid stable albeit unspectacular economic growth and only gentle interest rate rises. However, as The FT details, all is not well in reality, and the following seven charts will hearten investors of a more bearish persuasion…
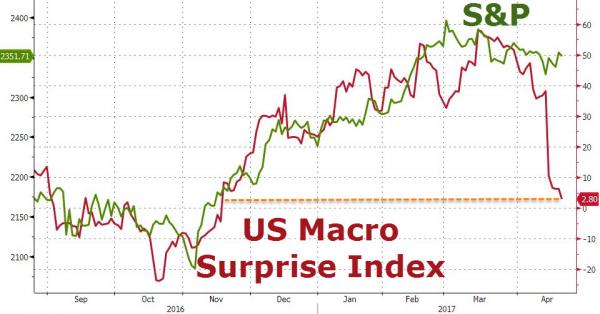
After climbing to its highest in 3 years earlier in 2017, Citi’s Economic Surprise index — which gauges how well data come in better than expected — has sagged badly lately. In fact, this week saw the biggest drop in US Macro data in 6 years (after poor readings on job creation, inflation, housing starts and car sales)…
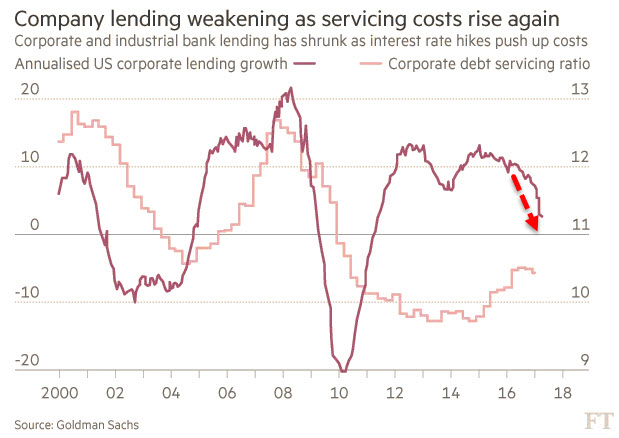
US corporate lending has also been unexpectedly weak, raising eyebrows among economists. Here is a chart from Goldman Sachs showing the growth of commercial and industrial loans has fallen sharply recently, while corporate debt servicing costs have been climbing to more normal levels reflecting rising indebtedness and the Federal Reserve’s interest rate increases. Goldman Sachs’s economists point out that debt servicing costs are likely to continue to rise, given the central bank’s plans to tighten monetary policy further.
as The FT details,
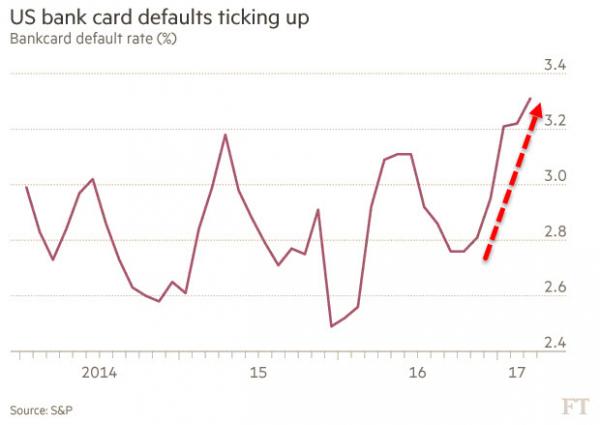
The consumer lending side is also looking less than ideal, with many households and individuals struggling with big student loans, credit card debt and car loans, after a period of anaemic wage growth. Signs of some stresses can be seen in the uptick in S&P/Experian’s bank card default rate.
as The FT details,
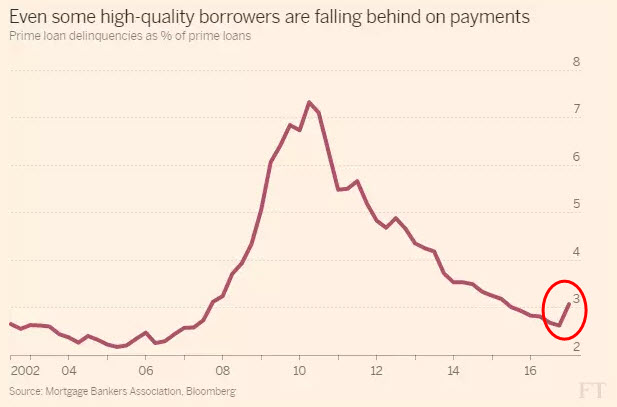
Even the default rate on high-quality “prime” loans edged up in the last quarter of 2016, according to the Mortgage Bankers Association.
as The FT details,
Meanwhile, one of the most accurate measures of looming recession risk is the bond market “yield curve” shaped by bonds of various maturities flattening or even inverting. The US yield curve is far from inverting, but it has flattened sharply again this year, after steepening following the US election in November. The difference between two and 10-year US Treasuries this week compressed below 100 basis points for the first time since November, and many analysts expect it to flatten further as the Fed keeps raising interest rates. As is clear from the chart below, bonds are tracking ‘real’ economic data and stocks are tracking ‘soft’ survey hope…


Leave A Comment