
The American labor market created 142K jobs in September. Weaker than the 200K the market expected, although an improvement from the downwardly-revised 136K in August.
No one generally remembers more than 7 things at once, so here’s a summary the American labor market in 7 charts.
Labor Market – #1 Monthly Job Growth
First, on a positive note, monthly job growth at +142K broke the four month streak of continued job growth deceleration.
The monthly job growth picture peaked in April 2015 at 260K. Since then, job growth weakened until September, when job growth gingerly reaccelerated from the 136K of August.
It’s weak, but not too weak. Yet.

#2 Year-over-year Job Growth
Second, on a year-over-year basis, the jobs picture looks a little better, with growth at 1.97%. This beats population growth of 1.5%.
Concerning, though, is the decelerating trend in growth that began in February 2015. It’s fairly easy to argue that the American labor market is neither too hot, nor too cold.
Of course, labor markets move in bursts and busts, not continuous growth.

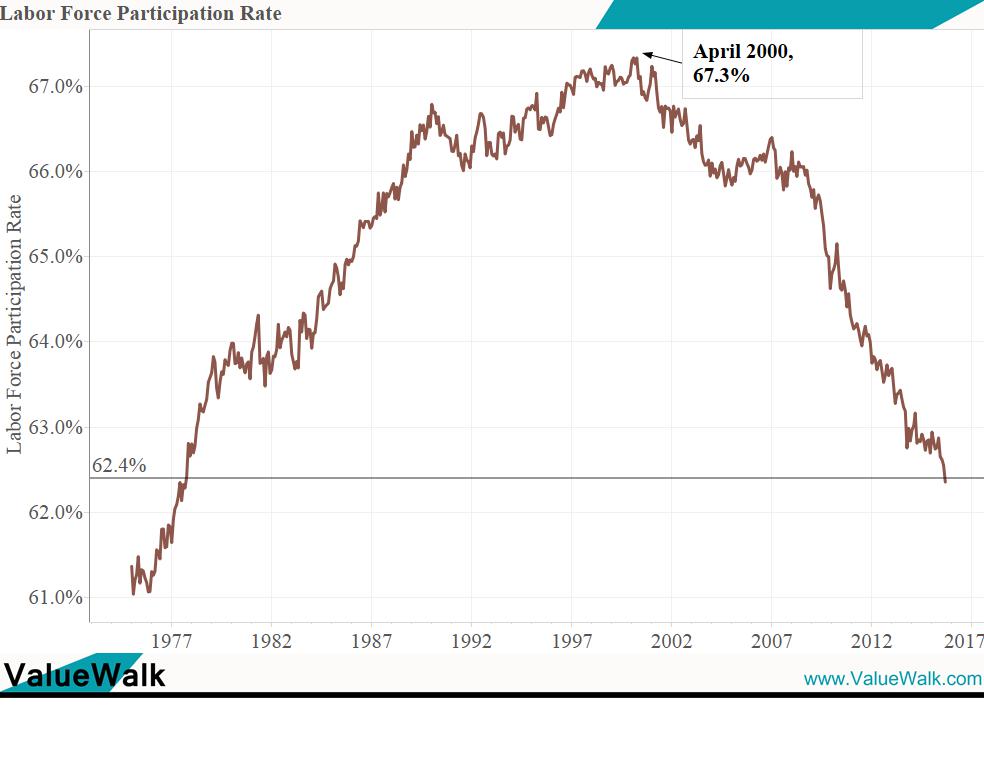
#3 Labor Force Participation Rate
The Labor Force Participation Rate is at a low not seen since October 1977.
Although the Labor Force Participation Rate is low, it doesn’t necessarily signal anything negative about the state of labor. The Labor Force Participation Rate has been declining since the 2000s, probably indicating that the continually declining participation is more secular than cyclical.
Americans apparently are figuring out that working isn’t all it’s cracked up to be. Who would have thought.
#4 Sector Inspection Says Things are OK, although Some Concern
The sector look follows. It shows the percentage growth in employment by broadly classified sectors during 2015. Overall, Professional and Business Services is on top at 2.10%.


Leave A Comment