Last week, I noted:
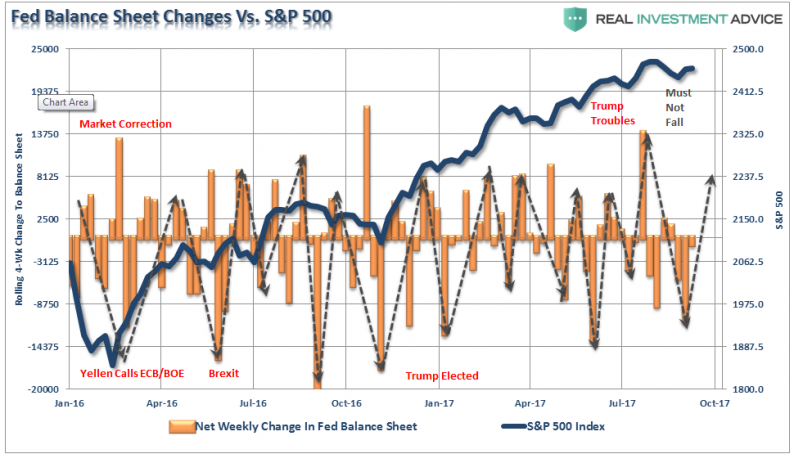
“I have a sneaky suspicion that when I update the Fed Balance Sheet reinvestment analysis next week, shown below, we are going to find a substantial, well-timed, reinvestment by the Central Bank. Wanna bet?”
Well, here is the updated chart of the 4-week net change to the Fed’s balance sheet. As you can see, reinvestments have, once again, returned to the market in a very “timely” fashion. Of course, since the Fed claims they are not trying to, nor are they influenced by, the markets, this is purely coincidental. (#SarcasmAlert)

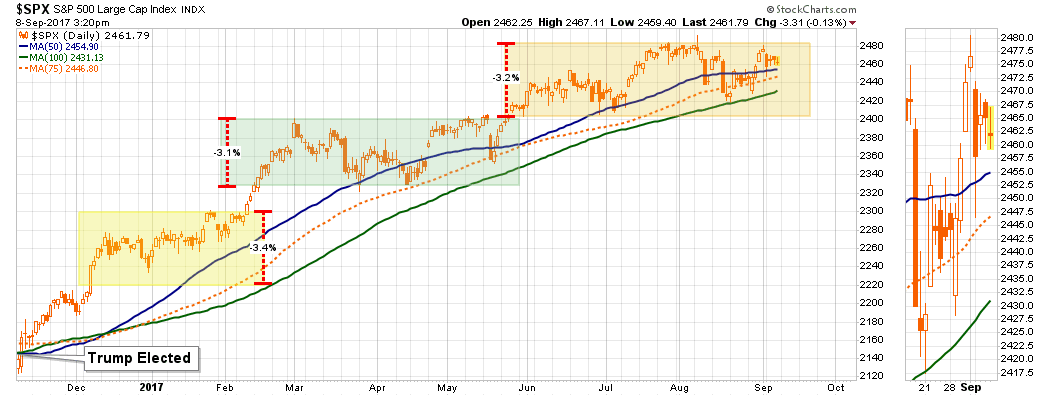
The good news this week is that the market maintained last week’s advance despite the one-day tantrum earlier this week. Interestingly, since the election, the market has ratcheted higher in slightly more than 3% increments with each move higher followed by a drawn-out consolidation process that runs primarily along the 50-75 dma. The last sell-off tested, and held, the 100-dma but stayed within the confines of the consolidation process. The 2400 level on the S&P 500 remains the clear “warning level” for investors currently.
But this short-term bullish backdrop is offset by intermediate-term bearish underpinnings as shown by the next two charts. With an intermediate-term momentum sell-signal in place, combined with overbought conditions, continues to suggest further gains from this point will likely remain limited and more volatile to obtain. That statement DOES NOT preclude the markets reaching new highs, it just suggests that downside corrective risks outweigh the potential currently for further gains.

The bigger concern continues to be the internal deterioration of the markets as the number of stocks on bullish “buy signals” and the number of stocks above their 200-dma continue to deteriorate. Again, this is more supportive of a continued correctionary process versus a reversal and strong push higher in asset prices.
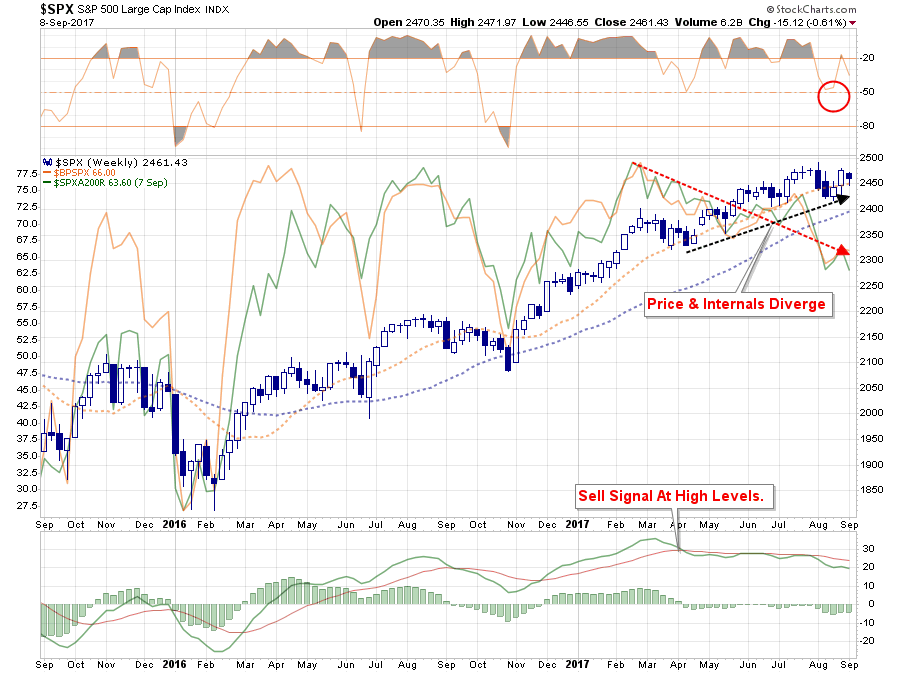
Importantly, as I will discuss momentarily, there are technical similarities suggesting we could be closer to the next major market reversal than not. While the markets are currently on a longer-term “buy signal,” as shown at the bottom of the chart below, the current signal is similar to what was seen in the run up to the peak of the “dot.com” bubble.
Notice that in 1998, the “buy signal” was reversed temporarily by a sharp sell-off in the market due to the collapse of “Long-Term Capital Management.” A test of the “bullish” trend held and the markets reversed as the “dot.com” bubble ensued. The next “sell signal” denoted the beginning of the market topping process and prices followed soon thereafter.
With a large deviation from the bullish trend, combined with a long-term signal at very high levels, the next reversal that violates the bullish trend will very likely signal the beginning of a more protracted bear market.

The warning signs are stack up on a technical basis suggesting the “risk” is becoming more elevated. While the bullish trend remains intact, keeping portfolios allocated toward equity risk currently, we are more focused on rebalancing and hedging risk in portfolios currently.
We agree with Howard Marks who recently stated:
“It’s time for caution, not a full-scale exodus.“
Yet.
As for what to do right now, we are pursuing the same strategy he discusses in his latest missive:
“Thus I would mostly do the things I always have done and accept that returns will be lower than they traditionally have been. While doing the usual, I would increase the caution with which I do it, even at the cost of a reduction in expected return. And Iwould emphasize “alpha markets” where hard work and skill might add to returns, since there are no “beta markets” that offer generous returns today.
‘Move forward, but with caution.’”


Leave A Comment