
Last week, we talked about the effect of the French election on the gold and silver markets, and noted:
Of course, traders want to know how this will affect gold and silver. As we write this, we see that silver went down 30 cents before rallying back up to where it closed on Friday. Gold went down about $20, and then half way back up.
At this point, we are not sure if the metals are supposed to go up because more printing. Or go down because the euro constrains France from printing. Or silver at least should go up because the economy is going to be better with France remaining in the Eurozone. Or go down because the ongoing malaise will only progress as it has been. Or some other logic… and the price gyrations this evening show that traders don’t agree either.
It didn’t take too long. Here is what happened to silver this week. The graph below shows the price of silver in real money (i.e. gold).
The Price of Silver in Real Money
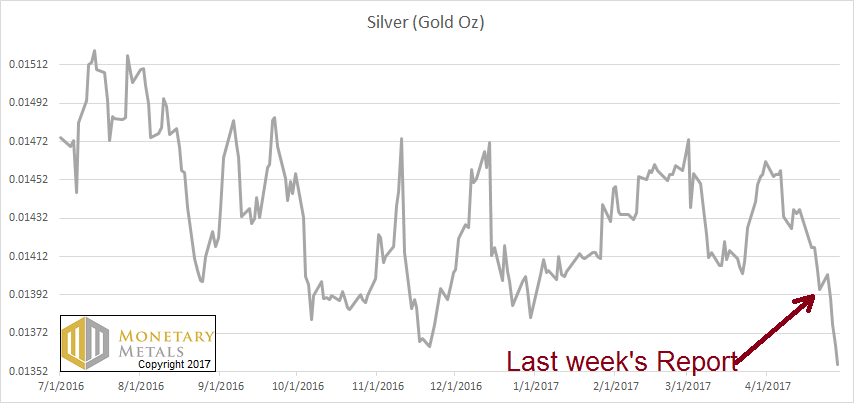
Silver has been falling for going on one year, but clearly since March 1. After one last hurrah at the end of March, it has been taking the elevator down. And by its fundamentals it should be quite a bit lower—0.0125.
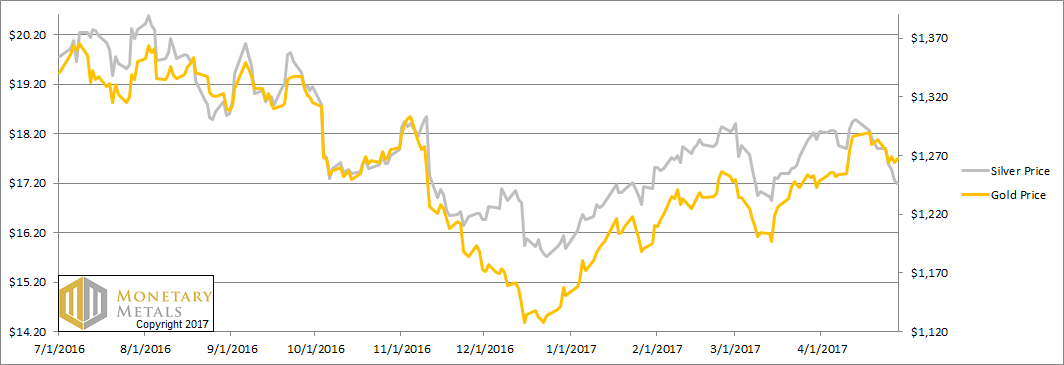
In any case, we are interested in watching what the fundamentals of the metals are doing. We will take a look at the graphs below, but first, the price and ratio charts.
The Prices of Gold and Silver
Next, this is a graph of the gold price measured in silver, otherwise known as the gold to silver ratio. It had another major move up this week, after a major move up last week.
Last week, we said:
If prior peaks are an indication, there may be a spot of resistance at 72.5 (+0.8 above Friday’s close) and another at 73.25. If the ratio should go over these levels, then it may go all the way to its fundamental level (discussed below).
Well, it broke those levels and ended the week just under 74.


Leave A Comment