
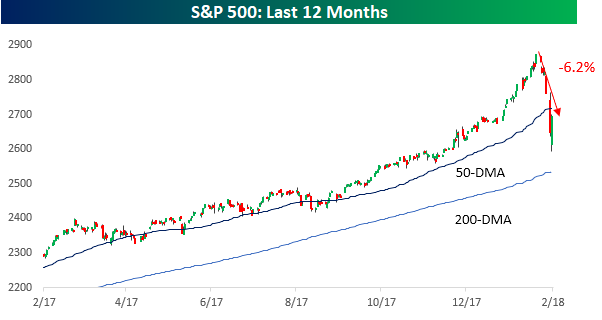
In looking at equity market returns in the US and Europe since the January highs, both the S&P 500 and Europe’s benchmark STOXX 600 have seen declines of similar magnitudes. Depending on which side of the Atlantic you reside on, however, the level from which equities sold off is entirely different. Let’s start with a look at recent performance from the eyes of a US investor.
As shown in the top chart below, the S&P 500 headed into Wednesday down 6.2% from its January high. The index ended its 100+ trading day streak of consecutive closes above its 50-DMA on Monday, and even after an enormous intraday rebound on Tuesday, it remains below that level.
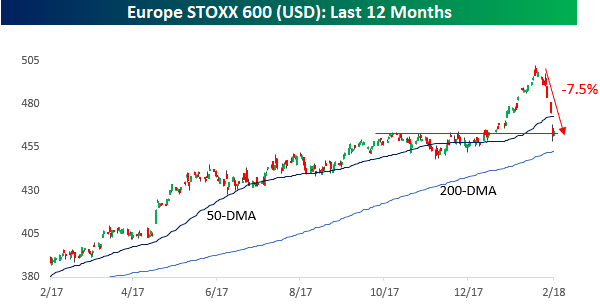
The chart of the STOXX 600 looks similar to the S&P 500.Up until late January, US investors saw steady gains in the index on a dollar-adjusted basis. Since the late January peak, though, the index has seen a decline of 7.5% and like the S&P 500 broke down below its 50-DMA earlier this week. As shown in the chart, though, at current levels the index is sitting right at a pretty significant support level.
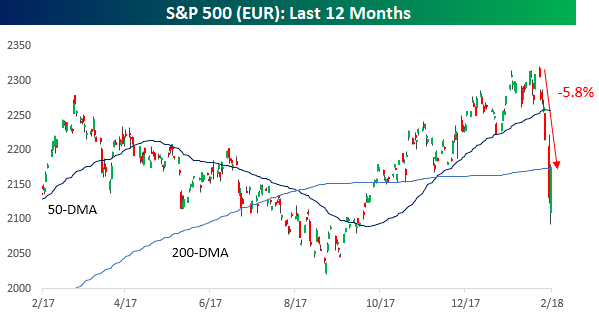
While the recent declines in the S&P 500 and STOXX 600 look like nothing more than a blip relative to a longer-term uptrend, from the perspective of a European investor, the charts look a lot less encouraging. While the S&P 500 is off just 5.8% relative to its January highs in Euro terms, that January high was only modestly above where it was trading a year ago. In other words, while US investors have seen the S&P 500 rally 17.5% in the last year, European investors who bought the S&P 500 are up less than 2% after accounting for the dollar’s weakness!
Similarly, the chart of the STOXX 600 looks much weaker in local currency terms than the dollar-adjusted version above. January’s high represented just a modest breakout from prior resistance that quickly failed miserably as the index is now comfortably below both its 50 and 200-day moving averages. Over in Europe, they’re saying, “Bull? What bull?”


Leave A Comment